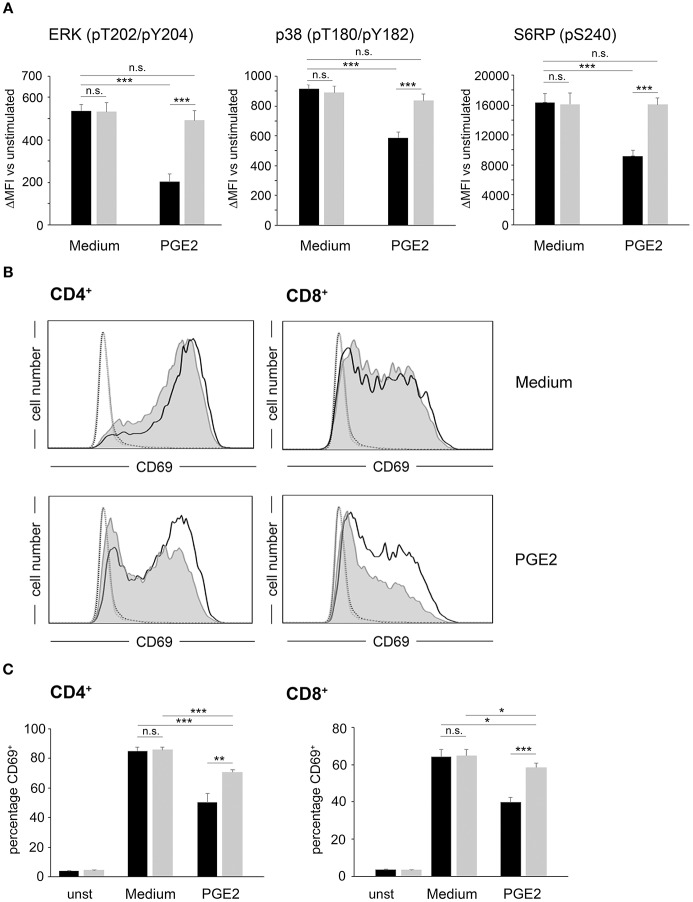
Figure 2.
Overexpression of PDE4A restores early activation parameters in peripheral blood T-cells under suppression by PGE2. (A) FACS-sorted control-vector transduced (black bars) or PDE4A transduced (gray bars) human peripheral blood T-cells were activated using anti-CD3/anti-CD28 antibodies in the absence (Medium) or presence of 200 nM PGE2. After 24 h, phosphorylation of the indicated signaling proteins was measured by intracellular flow cytometry. Data show the increase in mean fluorescence intensity to the respective unstimulated cells. Mean values + SD from four independent experiments are depicted. (B) FACS-sorted control-vector transduced (gray filled histograms) or PDE4A (black line) transduced CD4+ (left panels) or CD8+ (right panels) human T-cells were either left unstimulated (dotted line and fine gray line) or were activated for 24 h in the absence (upper panels) or presence (lower panels) of 200 nM PGE2. After 24 h, CD69 expression was measured by flow cytometry. One representative experiment (n = 4) is depicted. (C) The percentage of CD69+ control-vector (black bars) or PDE4A- (gray bars) transduced CD4+ (left panels) and CD8+ (right panels) T-cells either unstimulated or activated for 24 h in the absence (Medium) or presence of 200 nM PGE2 is depicted. Mean values + SD from four independent experiments are shown. n.s., not significant; *p < 0.05; **p < 0.01; ***p < 0.001.

