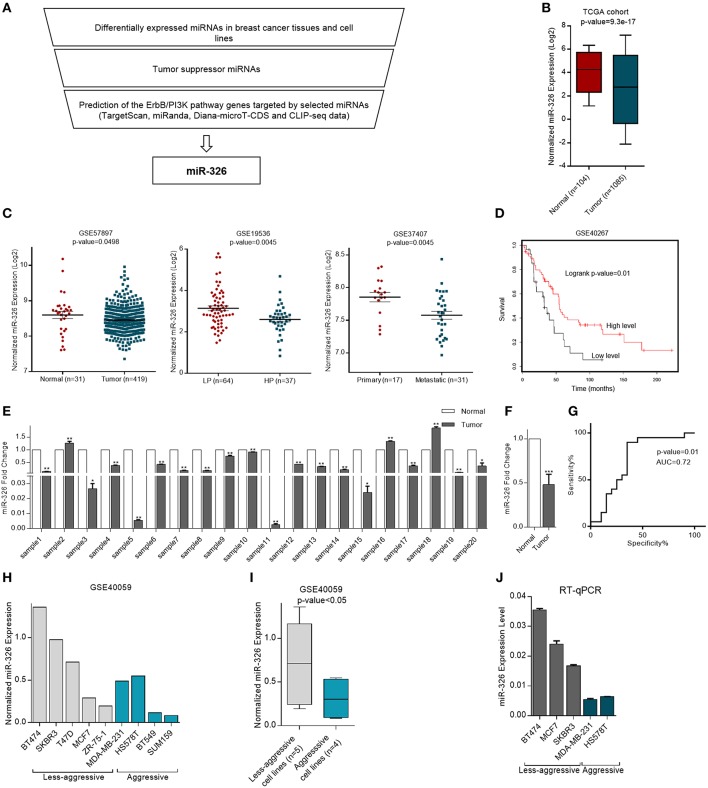
Figure 1.
Expression of miR-326 in human cancerous and normal breast tissues and cell lines. (A) miR-326 selection strategy flowchart (B) Differential expression of miR-326 in breast cancer and non-cancerous tissues from the TCGA database. (C) Expression profiles of miR-326 in breast cancer and normal breast tissues, in breast cancer patients with low proliferative (LP) and high proliferative (HP) tumors and in primary and metastatic tumors from (GSE57897, GSE19536, and GSE37407) datasets, respectively. (D) Kaplan–Meier survival analysis of breast cancer patients from GSE40267 dataset with different miR-326 expression. (E) The miR-326 expression in human breast cancer tissues compared to their adjacent normal pairs were detected by RT-qPCR. N = 20 for each group. (F) The mean Fold Change for breast cancer patient. (G) ROC curve for identification of patients with breast cancer vs. healthy controls (N = 20 for each group) using miR-326. AUC, area under the ROC curve. (H) Expression of miR-326 in aggressive and less-aggressive breast cancer cell lines from GSE40059 dataset. (I) The mean of expression for each group. (J) RT-qPCR analysis of the miR-326 in aggressive and less- aggressive breast cancer cell lines. Assays were performed in triplicate. Means ± SEM was shown. Statistical analysis was conducted using student t-test.

