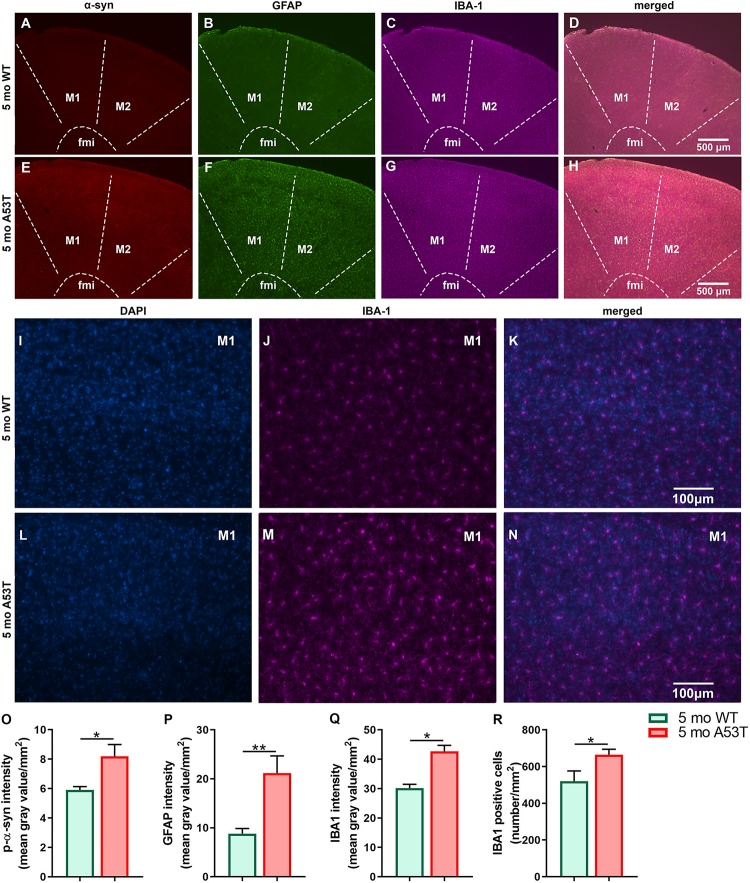
FIGURE 3.
Expression of the p-α-syn, GFAP, and IBA1 in the motor cortex of 5-month-old WT and A53T mice. Representative IF microphotographs of the p-α-syn, GFAP, IBA1, and merged image in 5-month WT mice (A–D) and A53T mice (E–H) used for densitometry analysis. Representative IF microphotographs of the DAPI, IBA1, and merged image in 5-month WT mice (I–K) and A53T mice (L–N) used for IBA1-positive cell density analysis. Image J was used to quantify the intensity of p-α-syn, GFAP, and IBA1 staining and density of IBA1-positive cells. Increased expression of the p-α-Syn (O), GFAP (P), and IBA1 (Q) was observed in A53T mice compared to WT mice. (R) The A53T mice showed increased density of IBA1-positive cells (n = 5/group; *p < 0.05, ∗∗p < 0.01).

