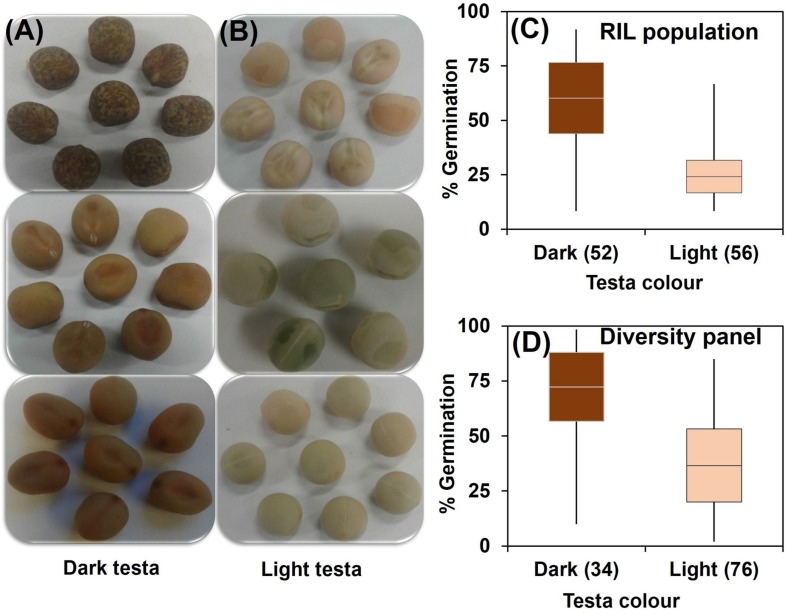
FIGURE 3.
Categorization of testa color into (A) dark and (B) light; and distribution of genotypes based on testa color and germination from waterlogged soil for (C) RIL population and (D) diversity panel. Box plot represents mean germination (mid-point of box plot), standard error (box plot length), together with minimum and maximum values (whisker bars). The number in parentheses denotes the number of genotypes per group.

