Figure 6.
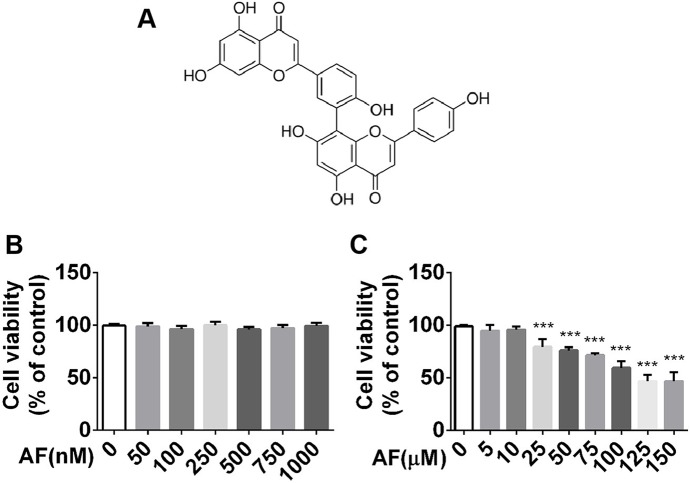
MTT analysis of the effect of amentoflavone on viability of BV2 microglial cells. (A) Structure of amentoflavone. (B) Viability of BV2 microglial cells treated with amentoflavone in graded concentrations (0, 50, 100, 250, 500, 750, or 1000 nM) was measured by MTT assay (one-way ANOVA followed by Dunnett’s test). (C) Viability of BV2 microglial cells treated with amentoflavone in graded concentrations (5, 10, 25, 50, 75, 100, 125, and 150 µM) was measured by MTT assay (one-way ANOVA followed by Dunnett’s test). Error bars represent mean ± s.d. Compared to control group, *** represents p < 0.001. All experiments were performed in triplicate. AF, amentoflavone.

