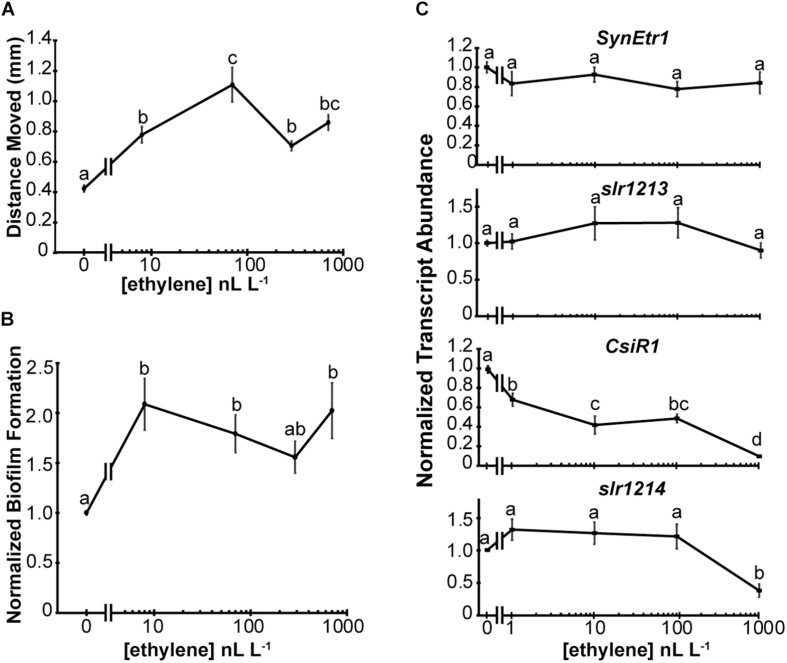
FIGURE 4.
Synechocystis responds to low levels of exogenous ethylene. The effects of various dosages of exogenous ethylene on Synechocystis were measured. (A) Phototaxis assays were conducted and the maximum distance moved from the initial colony position measured. (B) Biofilm formation was quantified by measuring the staining of attached cells using Crystal Violet. Data are normalized to staining of cells in the absence of ethylene. In panels (A,B), cells were kept in flow-through chambers maintained at 0, 8, 70, 290, or 700 nL L–1 exogenous ethylene for 4 d and data are the average ± SEM. (C) The gene transcript abundance of SynEtr1, slr1213, CsiR1, and slr1214 was measured using qRT-PCR from RNA extracted from cells maintained at 0, 1, 10, 100, or 1000 nL L–1 exogenous ethylene for 4 h in sealed chambers under phototaxis conditions. Data were normalized to the transcript levels of the TrpA reference gene and normalized to cells kept in ethylene-free air. Data represent the average ± SEM from three biological replicates with three technical replicates each. In all panels, statistical analyses were done with ANOVA and the different letters indicate significant differences (P < 0.05).

