Figure 3.
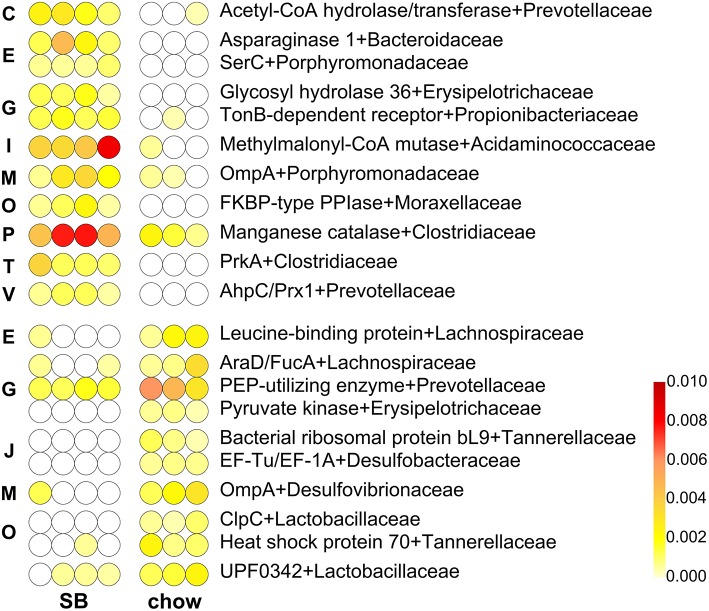
Differential family-specific microbial functions in rats fed chow supplemented with bread leavened with sourdough (SB) vs. chow only. In each line, a dot represents a single animal, with its color intensity being proportional to the relative abundance of that given microbial protein in that subject, according to the scale depicted in the bottom-right corner. Missing values (function not identified in that animal) are in white; features with missing values in the most abundant group were filtered out. The upper part of the heatmap lists functions with higher abundance in the fecal microbiota of SB-fed animals, while the lower part lists those with higher abundance in the fecal microbiota of chow-fed animals. Functions are ordered based on the Cluster of Orthologous Groups (COG) category to which they belong (C, Energy production and conversion; E, Amino acid transport and metabolism; G, Carbohydrate transport and metabolism; I, Lipid metabolism; J, Translation, ribosomal structure and biogenesis; M, Cell wall/membrane/envelop biogenesis; O, Posttranslational modification, protein turnover, chaperones; P, Inorganic ion transport and metabolism; T, Signal transduction mechanisms; V, Defense mechanisms), and then in alphabetical order.

