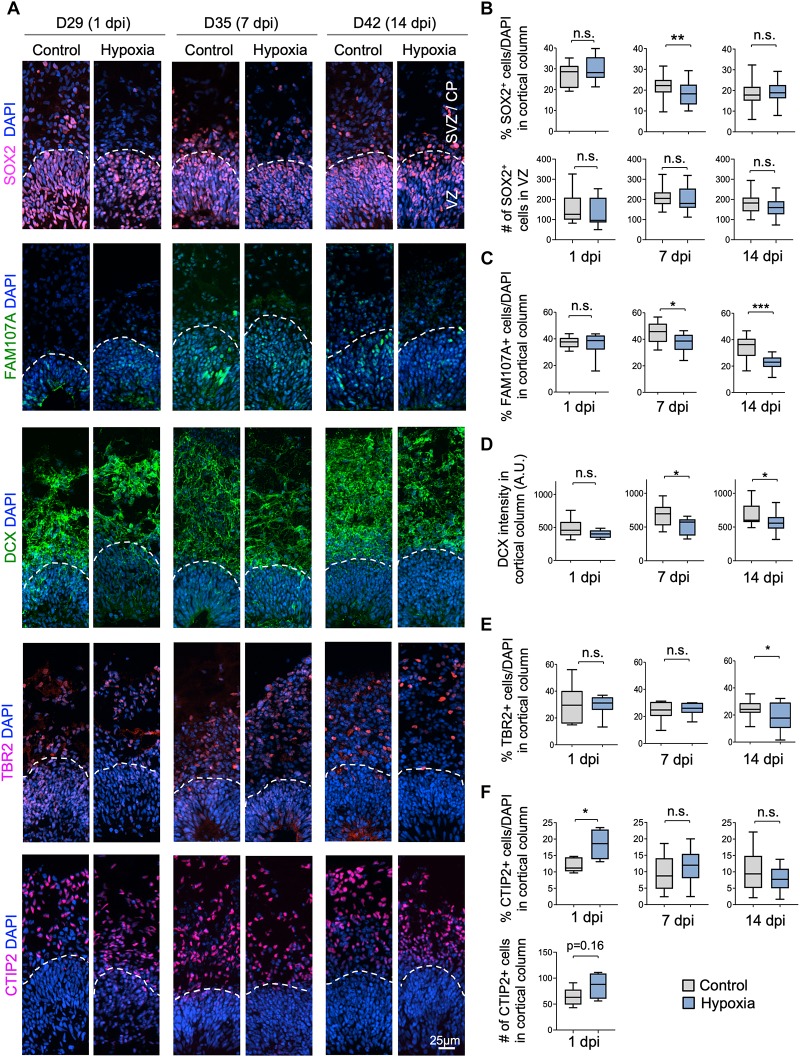
FIGURE 3.
Cellular distinction of different neural populations in response to HI. (A) IF images of representative 100 × 300 μm cortical columns labeled for the indicated markers at the indicated time points after hypoxia or control. White dashed lines demarcate VZ and outer layers (SVZ/CP). (B) Top graphs: quantifications of the percentage of DAPI+ cells across all cortical layers in radial columns that are positive for SOX2 at the indicated time points after hypoxia or control. Bottom graphs: quantifications of the number of SOX2+ cells in VZ-like layer at the indicated time points. Student’s t test, n = 9 organoids from three different batches. (C) Quantifications of the percentage of DAPI+ cells in cortical columns that are positive for FAM107A. Student’s t test, n = 9. (D) Quantifications of immunostaining intensity for DCX normalized to unit area (expressed as A.U.). Student’s t test, n = 9. (E) Quantifications of the percentage of DAPI+ cells across all cortical layers in radial columns that are positive for TBR2 at the indicated time points after hypoxia or control. (F) Top: quantifications of percentage of DAPI+ cells positive for CTIP2 in radial columns. Bottom: quantifications of the number of CTIP2+ cell in radial columns at 1 dpi. Student’s t test, n = 9. A.U., arbitrary unit. *p < 0.05; ∗∗p < 0.01; ∗∗∗p < 0.001; n.s., not-statistically significant.

