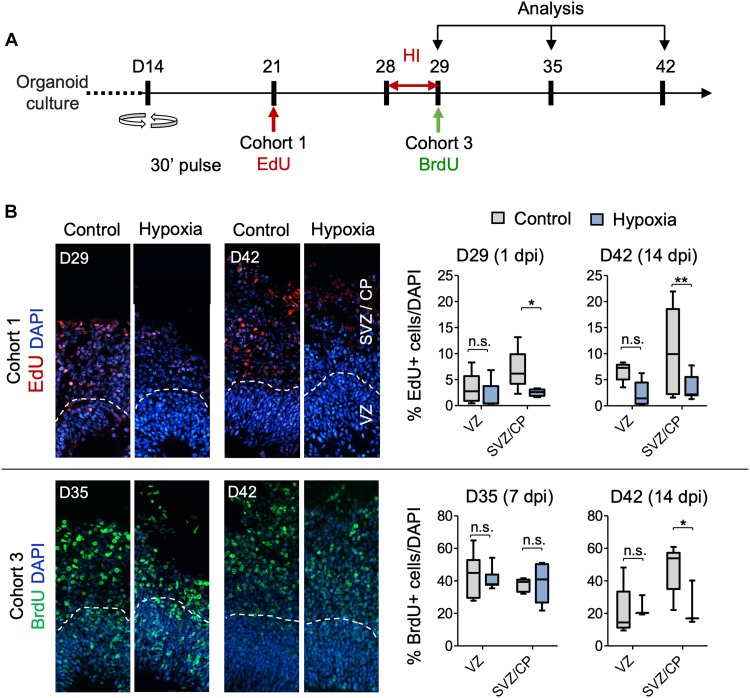
FIGURE 5.
Analysis of isochronic progenitor cohorts reveals vulnerable window and developmental stages affected by HI. (A) Timeline of experimental paradigm to analyze different isochronic cohorts (cohort 1 and 3) of neural precursors and their progeny that are birth-dated at different time points relative to transient HI using 30 min EdU or BrdU pulses followed by chase periods until analysis. (B) Left: Representative fluorescence images show abundance and spatial distribution of BrdU or EdU LRCs of isochronic cohort 1 or 3 at indicated time points during organoid development in control or after HI. White dashed lines demarcate VZ and SVZ/CP-like layers in 100 × 300 μm radial cortical columns. Right: Quantifications of BrdU+ or EdU+ LRCs in VZ or SVZ/CP layers. Two-way ANOVA followed by a Tukey post hoc test; n = 9 independent organoids from three different batches. *p < 0.05; ∗∗p < 0.01; n.s., not-statistically significant.

