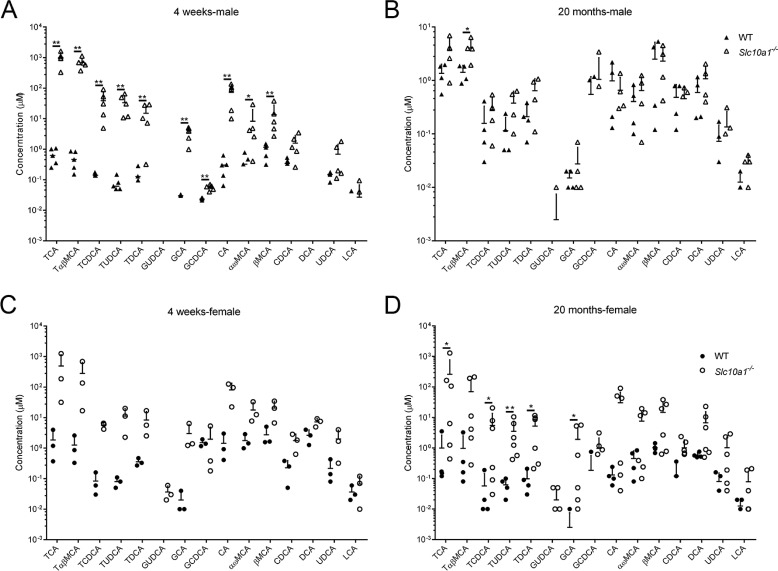
Figure 2.
Serum bile acid profiling of the Slc10a1−/− mice. Profiling of serum bile acids in male (A and B) and female (C and D) WT and Slc10a1−/− mice at 4 weeks and 20 months, respectively. BA species were quantified using UPLC-MS/MS. Data are given as mean ± S.D. (error bars) on a log-10 scale for 3–6 mice in each group. A mouse with BA species under the detection limit was not presented. *, p < 0.05; **, p < 0.01, two-tailed Mann–Whitney U test.

