Figure 5.
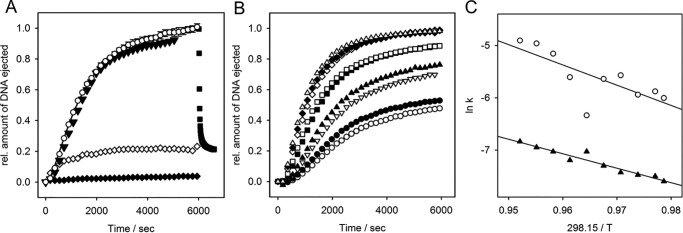
In vitro LPS-triggered DNA ejection from phage Det7. 8 × 10⁹ pfu mixed with 67 μg ml−1 LPS in the presence of a fluorescent DNA-binding dye. A, fluorescence signal obtained at 37 °C with S. Typhimurium LPS (white circles, mean values of three independent experiments with error bars representing the S.D.), with 10 nm purified Det7TSP added after 2 min (white diamonds), with DNase added after 6000 s (black squares), with S. Anatum LPS (black triangles), with S. Typhimurium LPS lacking O-antigen (white triangles). B, fluorescence signals obtained in the presence of S. Typhimurium LPS at different temperatures: 31.5 °C (white circles), 32 °C (black circles), 33 °C (inverted white triangles), 34 °C (black triangles), 36 °C (black squares), 37 °C (white squares), 38 °C (white diamonds), 39 °C (black diamonds), and 40 °C (white triangles). C, Arrhenius plots of rate constants obtained from fits of kinetic traces to a set of two consecutive first-order processes yielded activation barriers k1 = 19.2 kcal mol−1 (white circles) and k2 = 26.8 kcal mol−1 (black triangles). For curves determining the maximum receptor-saturating LPS concentration, see Fig. S8. For validation of the fitting procedure, see the supporting Methods.

