Figure 1.
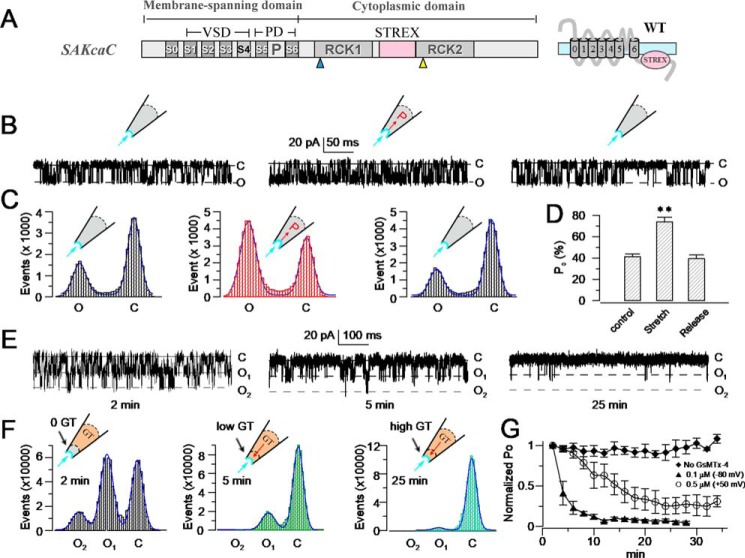
GsMTx4 inhibits SAKcaC from extracellular side of the cell membrane. A, schematic of SAKCaC. The transmembrane domain (S0–S6) contains a VSD (S1–S4) and a PD (P5–P6). The cytoplasmic domain contains two RCK (RCK1 and RCK2) domains and an extra exon STREX (pink) located between the RCK1 and RCK2 domains. B, sample traces illustrating the mechanosensitivity of SAKcaC. Left, before suction; middle, during suction (−40 mm Hg); right, after suction releasing. C, total histogram events of channel open (O) and closed (C) states corresponding to B were fitted to Gaussian functions. D, statistical comparison of Po for control (before suction), suction (−40 mm Hg), and release (without suction) conditions on the cell membrane (n ≥6). Data show that Po was significantly increased with −40 mm Hg suction (p < 0.01) and was reversed by release. E, typical single channel current traces showing the inhibitory effect of GsMTx4 on SAKcaC at the time points indicated; 100 nm GsMTx4 was back-filled in the pipette. F, total histogram events of single channel open (O) and closed (C) from E were fitted by Gaussian functions. G, time courses of normalized open probability (Po/Po (control)) for control (without GsMTx4) and during GsMTx4 diffusion to the patch membranes. The GsMTx4 concentrations used were 0.1 μm (Vm = −80 mV) and 0.5 μm (Vm +50 mV) as indicated (n = 4–8). Symbols: C beside traces indicates the channel closed levels; O1 and O2 represent the levels of two channels opening. Time points in E, F, and G were measured from the onset of backfilling (see “Experimental procedures”). SAKcaCs were recorded from chick ventricular myocytes. MPs in B and E were held at −80 mV. [Ca2+]i applied in the bath was 1 mm. **, p < 0.01.

