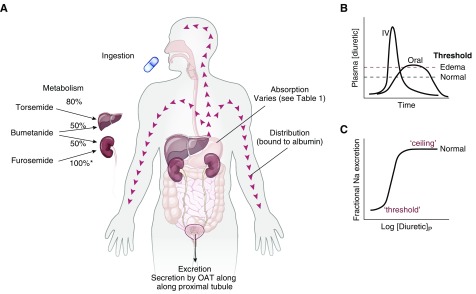
Figure 2.
(A) Features of absorption, distribution, metabolism, and excretion (so-called ADME) of drugs. (B) Comparing the plasma diuretic concentration as a function of time after oral or intravenous diuretic administration. The dashed lines show natriuretic thresholds in normal individuals and in those with edema. Note that the primary determinant of natriuresis is the time above the threshold, indicating why route of administration has different effects in stable patients and in those with severe edema. In a normal individual, an oral dose may be effective, whereas it may not be in edema despite retained bioavailability. (C) Classic dose-response curve, plotted versus the logarithm of the plasma concentration. Note the threshold for natriuresis and the maximal level, often called the ceiling. IV, intravenous.

