
Fig. 10.
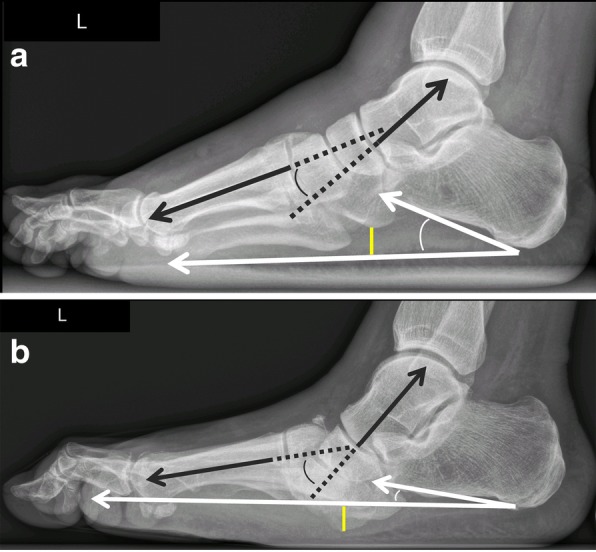
Lateral weight-bearing radiographs showing the typical course of Charcot foot disease over time (a baseline, b 10 months later). Note the continuous increase of Meary’s angle (black angle), the diminution of cuboid height, which is becoming negative (yellow distance) and the decrease of the calcaneal pitch (white angle) [19]