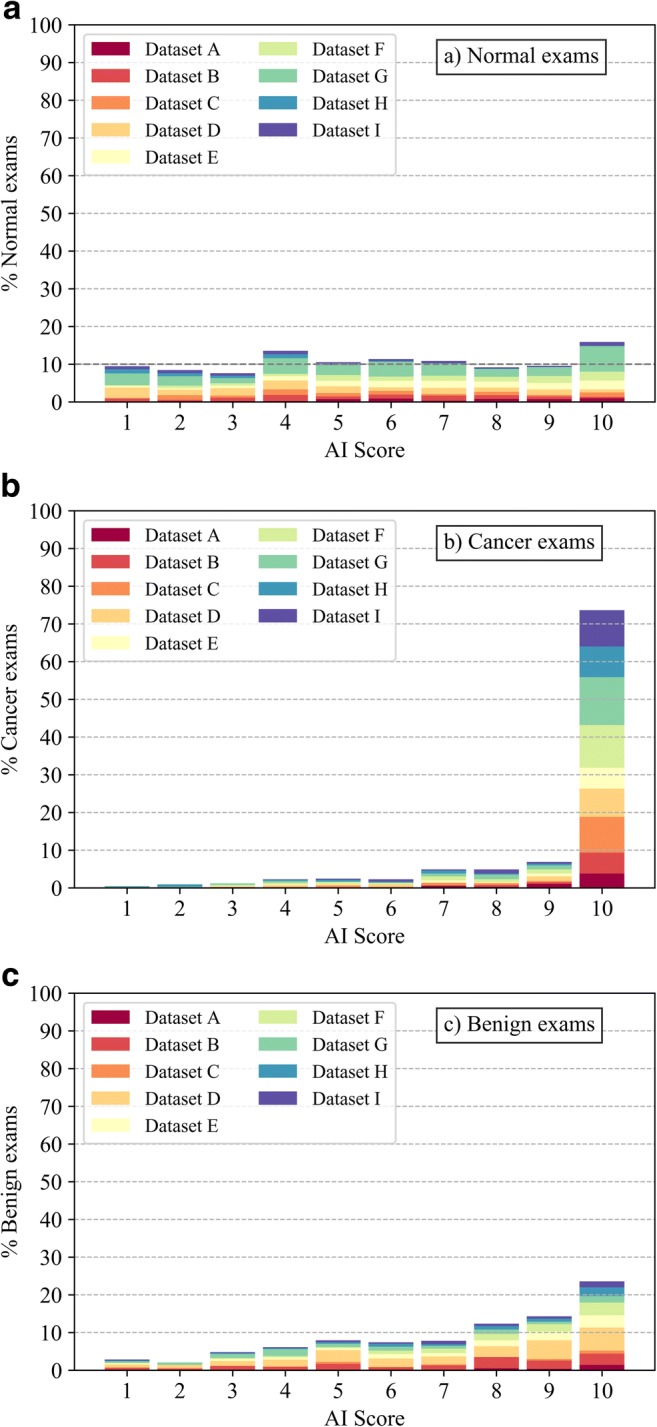
Fig. 1.

Distribution of normal (a), cancer (b), and benign exams (c) as a function of AI score, representing the likelihood of cancer present (1–10, 10 means high likelihood of cancer present). The contribution of each dataset to the overall percentage of exams is shown
