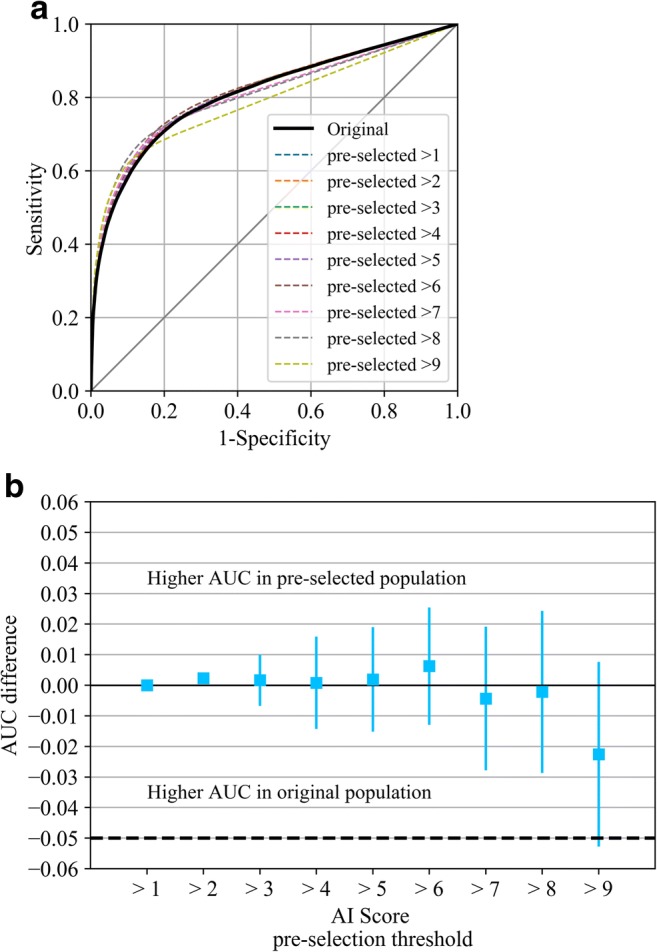
Fig. 4.

ROC curves (a) and change (b) in AUC values of the average of radiologists in the original population, as well as in all possible pre-selected populations (using all possible AI scores as threshold values for pre-selection for reading; if the case is not pre-selected, the radiologist score is converted to the lowest possible cancer suspicion score for the MRMC study). 95% confidence intervals are Bonferroni-corrected
