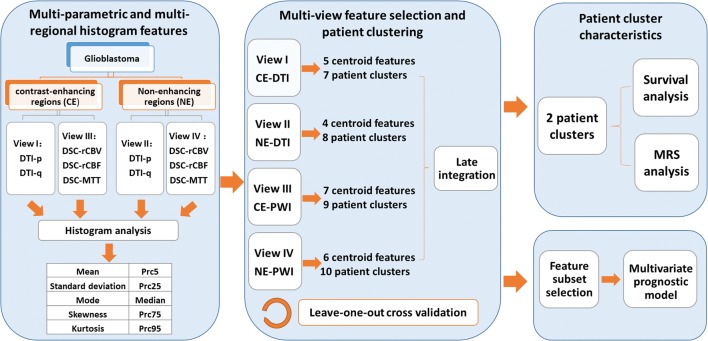
Fig. 1.
Study design. DTI-p and DTI-q maps are generated from diffusion tensor imaging (DTI). The relative cerebral blood volume (rCBV), mean transit time (MTT), and relative cerebral blood flow (rCBF) maps are generated from dynamic susceptibility contrast (DSC) imaging. Histogram features extracted from the multiple modalities and regions (contrast-enhancing and non-enhancing) are treated as four independent views. Each view is firstly clustered to select centroid features, which are later used to cluster patients. The resulting clusters from each view are integrated to yield two final patient clusters. A leave-one-out cross validation is performed. Patient clusters are assessed in survival analysis and their metabolic signatures are compared. The centroid features are ranked according to the importance in the clustering and selected features are used to build multi-variate prognostic model

