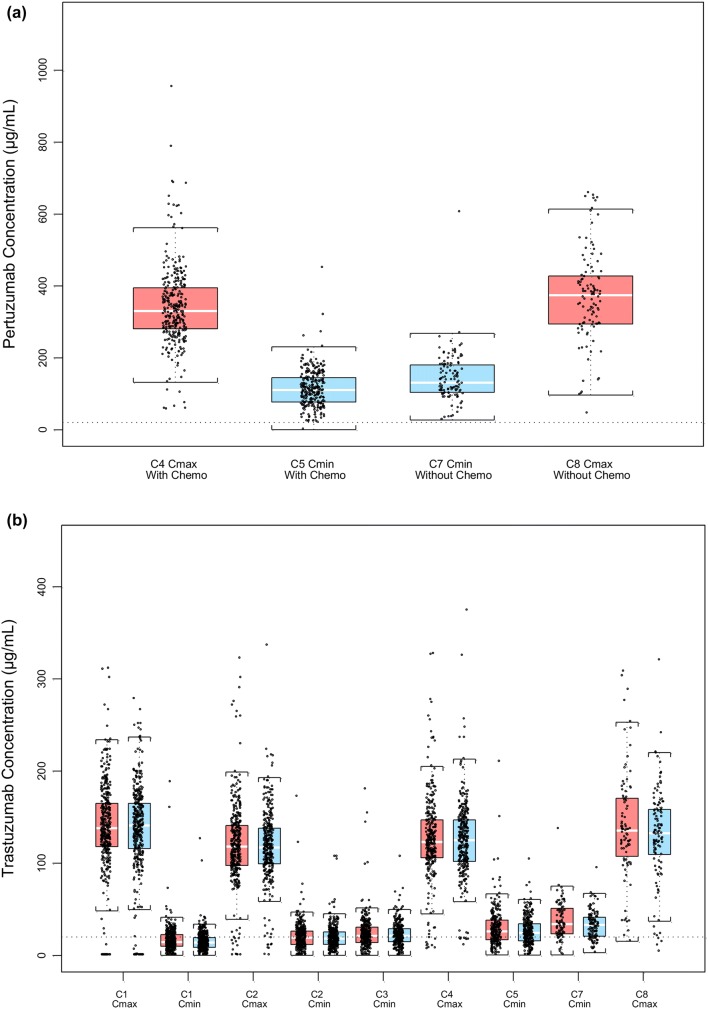
Fig. 2.
Drug–drug interaction assessment of the potential effects of a chemotherapy on pertuzumab exposure and b pertuzumab on trastuzumab exposure. C Cycle, Chemo chemotherapy, Cmax peak (maximum) serum concentration, Cmin serum trough (minimum) concentration, PK pharmacokinetic. Red bars = post-dose; blue bars = pre-dose; lower and upper ends of each box plot = 25th and 75th percentile exposure value; horizontal white line = median per group; points = individual PK data. Brackets extending from the ends of the box are drawn to the nearest value, not beyond 1.5-times the interquartile range

