Figure 1.
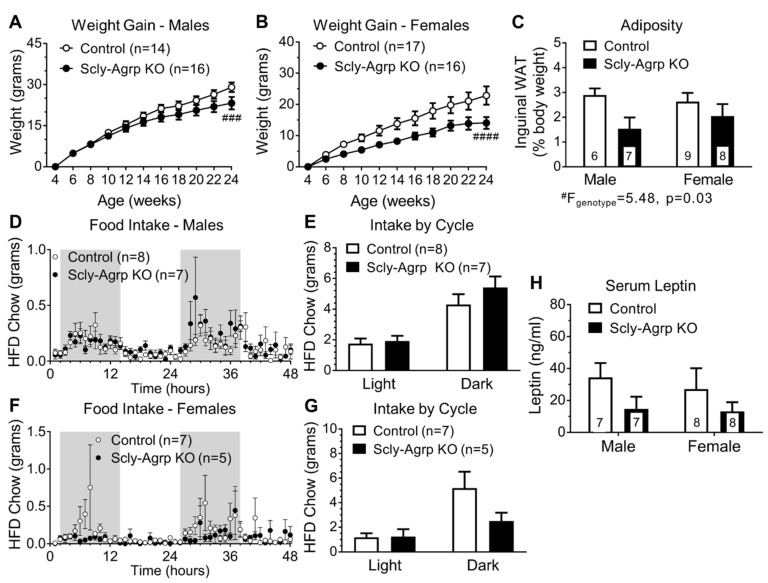
Metabolic characterization of high-fat diet (HFD)-fed Scly-Agrp knockout (KO) vs. control mice. (A) Weight gain on a high-fat diet in male Scly-Agrp KO mice vs. controls. Two-way ANOVA: genotype ### F(1,308) = 14.24, p = 0.0002; (B) Weight gain in females. Two-way ANOVA: genotype #### F(1,341) = 48.88, p < 0.0001; (C) Inguinal fat deposits, expressed as percent body weight, by sex and genotype. Two-way ANOVA: genotype # F(1,26) = 5.48, p = 0.03; (D) Food consumption over a 48-h period in male mice. Gray shading indicates dark cycle; (E) Comparison of total intake in males by cycle: Two-way ANOVA: genotype F(1,26) = 1.349, p = 0.26; (F) Food consumption in female mice; (G) Comparison of total intake in females by cycle. Two-way ANOVA: genotype F(1,20) = 2.118, p = 0.16, interaction F(1,20) = 2.303, p = 0.14; (H) Fasting serum leptin levels in male and female mice by genotype. Two-way ANOVA: genotype F(1,26) = 3.188, p = 0.086. All data are represented as mean ± standard error of the mean. Group numbers are indicated in each graph.

