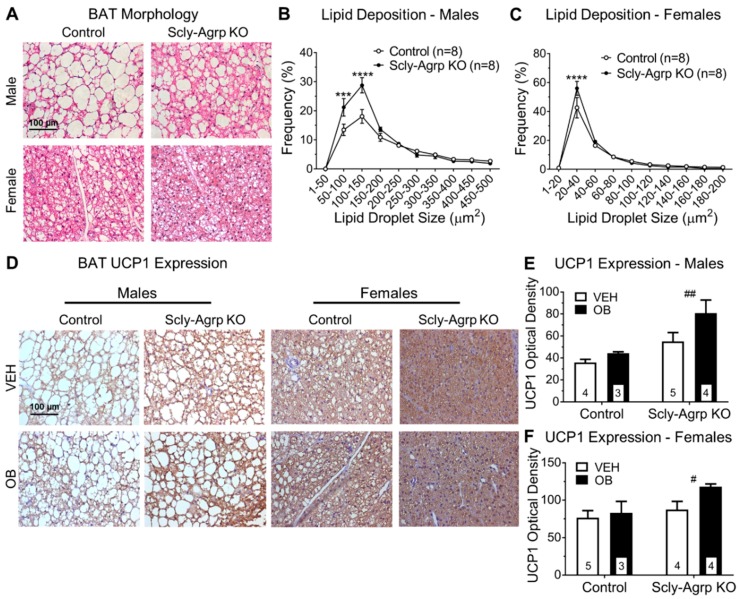
Figure 5.
Brown adipose tissue lipid deposition and thermogenesis in HFD-fed Scly-Agrp KO vs control mice. (A) Sample images of brown adipose tissue (BAT) sections stained with hematoxylin and eosin, showing adipocytes and lipid droplets at 40× magnification; (B) frequency distribution of lipid droplet size in BAT sections from male mice. Two-way ANOVA with repeated measures: genotype F(1,14) = 8.079, p = 0.013, interaction F(9,126) = 5.726, p < 0.0001, Bonferroni’s multiple comparisons test: *** p < 0.001, **** p < 0.0001; (C) BAT lipid droplet size in female mice. Two-way ANOVA with repeated measures: interaction F(9,126) = 2.418, p = 0.014, Bonferroni’s multiple comparisons test: **** p < 0.0001. Treatment with either vehicle (VEH) or leptin (OB) did not affect lipid droplet size; (D) sample images of uncoupling protein-1 (UCP1) immunoreactivity in BAT sections counter-stained with hematoxylin; (E) UCP1 expression in male BAT. Two-way ANOVA: ## genotype F(1,12) = 11.6, p = 0.005, leptin treatment F(1,12) = 4.35, p = 0.06; interaction F(1,12) = 1.407, p = 0.26 (F) UCP1 in female BAT. Two-way ANOVA: # genotype F(1,12) = 5.0, p = 0.04, leptin treatment F(1,12) = 3.27, p = 0.09, interaction F(1,12) = 1.35, p = 0.3. All data are represented as mean ± standard error of the mean. Group numbers are indicated in each graph. # denotes a significant genotype effect.

