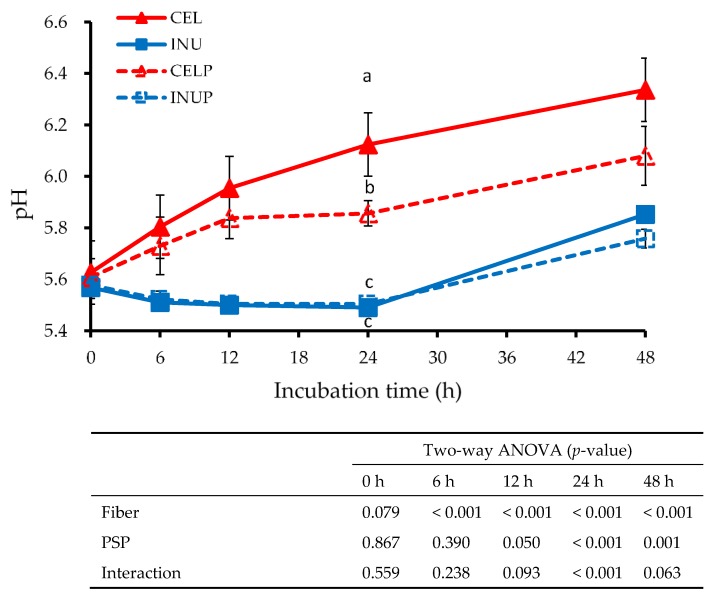
Figure 4.
The pH values for each sample treatments during in vitro colonic fermentation of 3% cellulose (CEL), 3% cellulose + 0.16% PSP (CELP), 3% inulin (INU), and 3% inulin + 0.16% PSP (INUP). Values are reported as mean and standard error (n = 5). Two-way ANOVA was performed to assess the effect of fiber (cellulose and inulin), PSP, and their interaction. If the variance was observed in the main effect of the interaction, Tukey’s test was used for this comparison. Mean values at the same time point designated by different letters (a–c) are significantly different (p < 0.05).

