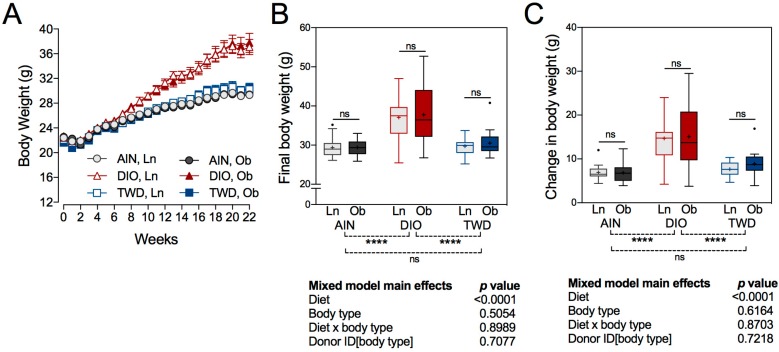
Figure 2.
Body weight gain. (A) Body weight gain over the 22-week study period. Data shown are the mean ± standard error of measurement (SEM) for each group. (B) Final body weight and (C) change in body weight data are presented as Tukey box plots (box, 25th to 75th percentiles; whiskers, 1.5 interquartile range (IQR); +, mean) (n = 6 to 9). The table to the right of this panel shows p-values for the main effects of each experimental factor as determined by the mixed model analysis. Below the plot, brackets indicate the results of Tukey post hoc tests for the overall effects of each diet. Within each diet group, symbols above the box and whisker bars indicate the results of post hoc tests comparing mice that received bacteria from lean (Ln) or obese (Ob) human donors. **** p < 0.0001, ns = not significant.

