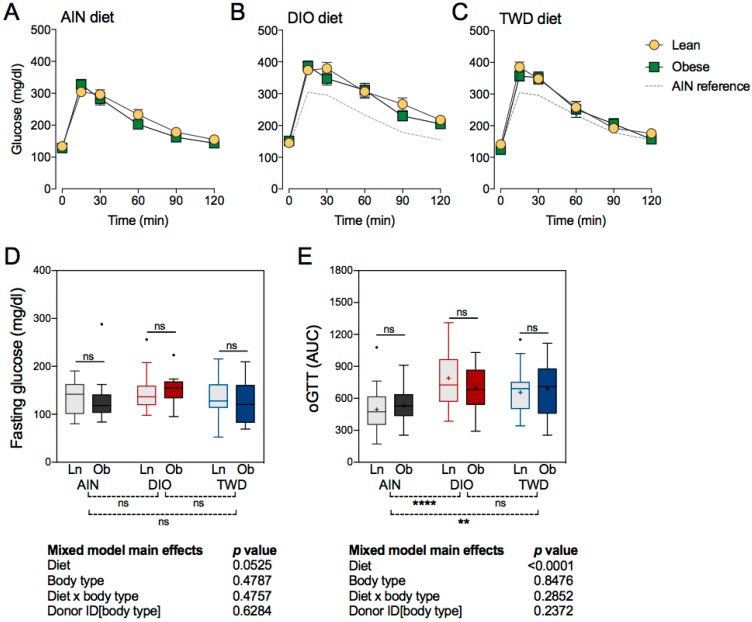
Figure 4.
Oral glucose tolerance test (oGTT). Glucose tolerance was assessed by calculating the area under the curve (AUC), with a baseline set at 100 mg/dl, for mice that received a fecal transfer from either lean (Ln) or obese (Ob) human donors. Data shown are mean ± SEM (n = 6 to 9) for blood glucose concentrations with respect to time following an oral glucose dose of 10 mg glucose/kg body weight in mice fed an AIN diet (A), DIO diet (B), or TWD diet (C). Fasting blood glucose (D) and oGTT AUC (E) values are shown as Tukey box plots (box, 25th to 75th percentiles; whiskers, 1.5 IQR; +, mean) (n = 6 to 9). The tables below each panel show p-values for the main effects of each experimental factor as determined by the mixed model analysis. Below each plot, brackets indicate the results of Tukey post hoc tests for the overall effects of each diet. Within each diet group, symbols above the box and whisker bars indicate the results of post hoc tests comparing mice that received bacteria from Ln or Ob human donors. ** p < 0.01, **** p < 0.0001, ns = not significant.

