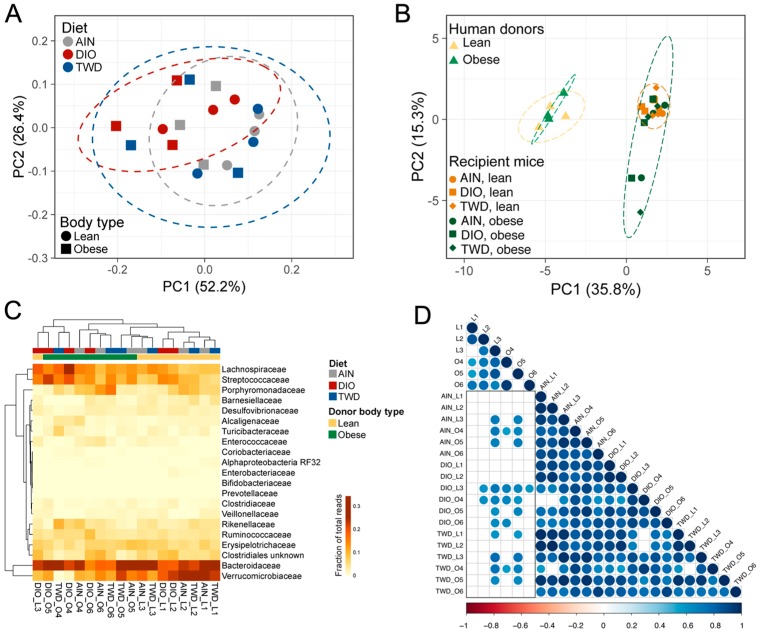
Figure 9.
Hierarchical clustering and principal components analysis of recipient mouse microbiomes post-FMT. (A,B) Principal components analysis (PCA) of family-level taxonomy data plotted according to the first two principal components for FMT recipient mice (A), comparing recipient mice to original human donors (B). Variation attributed to each component is shown. Dashed lines represent the 95% confidence ellipse. (C) Unsupervised, bidirectional hierarchical cluster analysis of taxonomy relative abundance data for bacteria families comprising at least 1% of the fecal microbiome from all mice prior to antibiotic treatment (pre-AB) and from each of the six human donors (lean: L1, L2, L3; obese: O4, O5, O6). Clustering was performed using Euclidian distance with average linkage. Heatmap color scale indicates relative abundance as fraction of total reads. (D) Pearson correlation plot showing correlation between human donor microbiomes and recipient mice. The color scale indicates the size and direction of the correlation coefficient. Only significant (p < 0.05) correlations are shown. The black box highlights the correlation of FMT recipient mice with their human donors.

