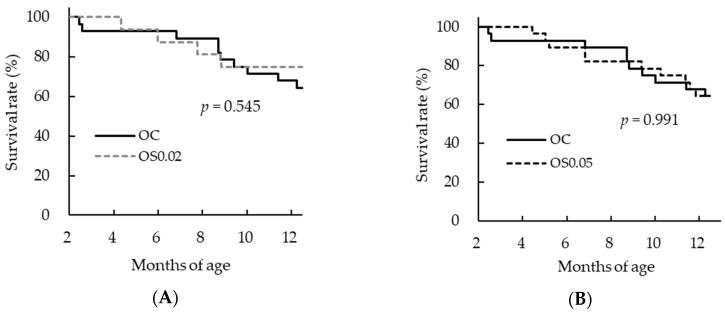
Figure 1.
Survival curves in old mice. (A) Old control, fed basal diet (OC) vs. old, fed basal diet supplemented with 0.02% sesame lignans (OS0.02), (B) OC vs. old, fed diet supplemented with 0.05% sesame lignans (OS0.05). The Survival curves for each group were estimated using the Kaplan–Meier method and differences in survival among the groups were tested using log rank tests with Bonferroni correction. p values less than 0.025 were regarded as statistically significant. There were no significant differences among the groups of aged mice.

