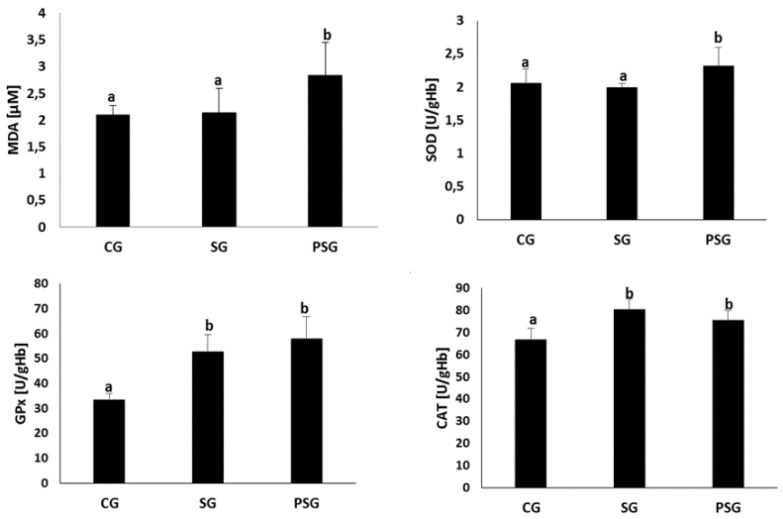
Figure 1.
Effect of frequent changes in diet or periodic starvation on plasma malonyldialdehyde (MDA) concentrations and erythrocyte superoxide dismutase (SOD), glutathione peroxidase (GPx), catalase (CAT) activities. CG—Control group, SG—Sugar group, PSG—Periodically starved group, a,b—Means marked with different letters in the same line are statistically different, p ≤ 0.05.

