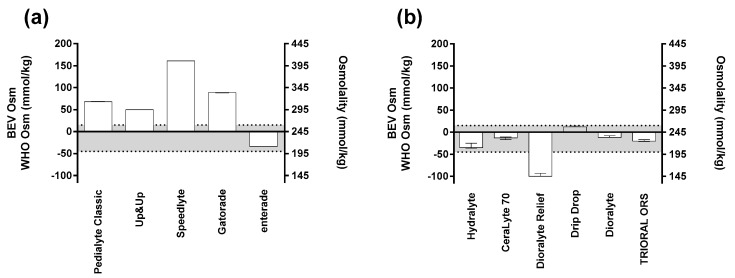
Figure 2.
Beverage osmolality for: (a) pre-mixed solutions; and, (b) reconstituted powders. The left y-axis denotes the difference between beverage and WHO-UNICEF osmolality; the right y-axis denotes the absolute beverage osmolality. Each bar represents the median value for the three bottles tested. The variation plotted represents the range. The horizontal dotted lines denote the optimal range for beverage osmolality (200–260 mmol/kg; see text for details).

