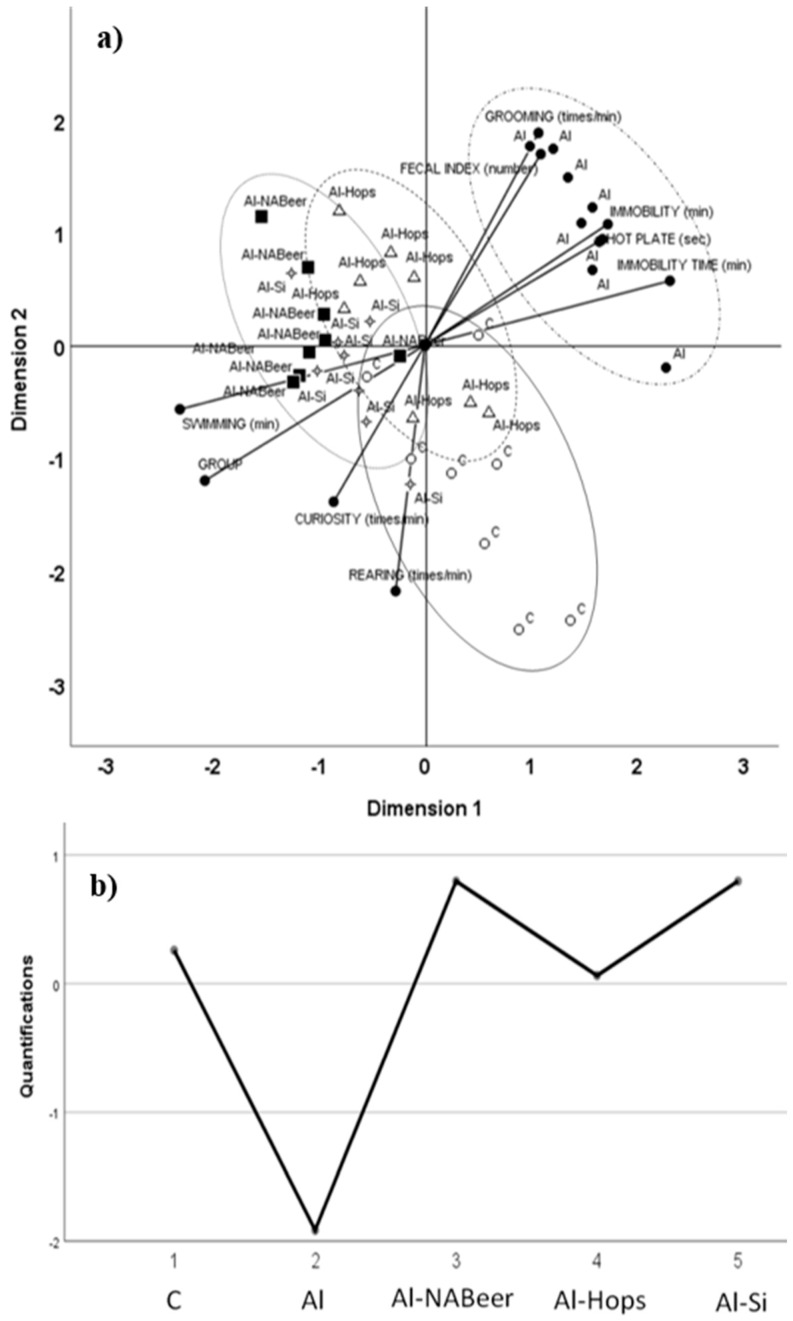
Figure 7.
(a) Categorical principal component analysis (CATPCA) scatter biplot using groups and nine behavioral variables: rearing, immobility, curiosity, grooming, fecal index, swimming time at the forced swimming test (swimming), immobility time at the forced swimming test, and reaction time (hot plate). (b) Optimal scaling level for the different groups: 1, control group; 2, aluminum-treated group; 3, aluminum plus non-alcoholic beer; 4, aluminum plus hops extract; and 5, aluminum plus silicon. The first and second dimensions accounted for 43.2% and 31.1% of variance, respectively (3.89 and 2.80, respective Eigen values). The ellipses drown surround data for each of the different experimental groups [123].

