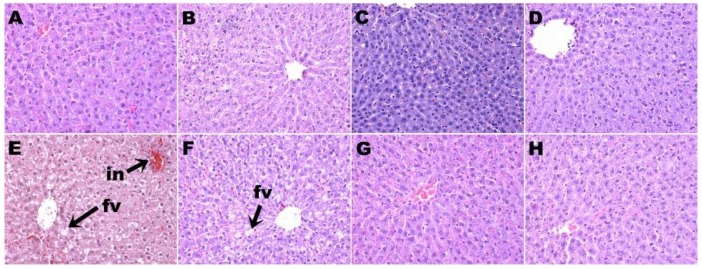
Figure 4.
Hematoxylin and eosin staining of liver showing fat vacuoles and infiltration of inflammatory cells (magnification ×20; shown by arrows) in corn starch diet-fed rats (A), corn starch diet-fed rats treated with whole linseed (B), corn starch diet-fed rats treated with defatted linseed (C), corn starch diet-fed rats treated with SDG (D), high-carbohydrate, high-fat diet-fed rats (E), high-carbohydrate, high-fat diet-fed rats treated with whole linseed (F), high-carbohydrate, high-fat diet-fed rats treated with defatted linseed (G), and high-carbohydrate, high-fat diet-fed rats treated with SDG (H). Fat vacuoles are marked as “fv” and inflammatory cells are marked as “in”.

