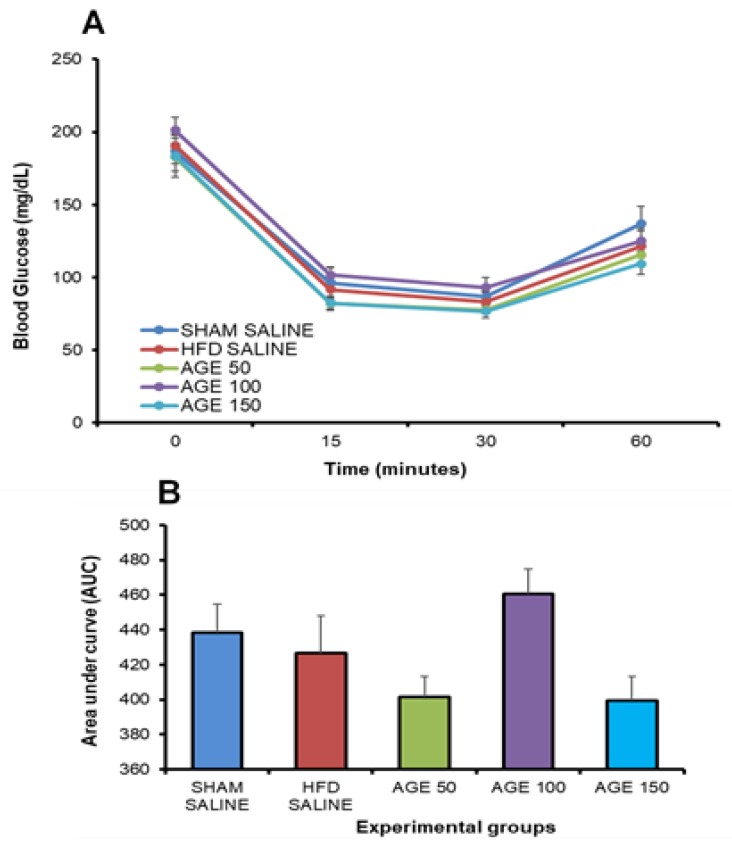
Figure 4.
Evaluation of the glycemic profile at the end of the treatment with AGE. (A) Insulin sensitivity test performed at the end of treatment. (B) Area under the curve (AUC) of the insulin sensitivity test at the end of treatment. SHAM SALINE: standard diet + saline solution. HFD SALINE: hyperlipidic diet + saline solution. AGE 50: hyperlipidic diet + 50 mg/kg of aqueous graviola leaf extract. AGE 100: hyperlipidic diet + 100 mg/kg of aqueous graviola leaf extract. AGE 150: hyperlipidic diet + 150 mg/kg of aqueous graviola leaf extract. Each column represents the mean, and the bar represents the mean standard error. ANOVA.

