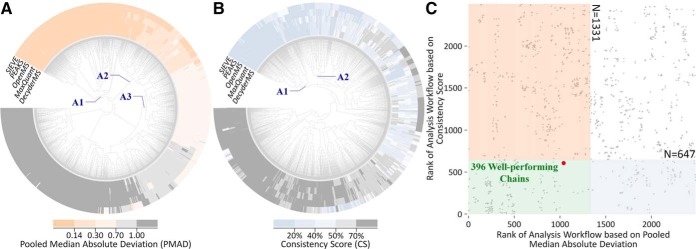
Fig. 6.
The strategy proposed in this study to discover the manipulation chains of simultaneously improved precision and robustness based on benchmarks collected from Table II, study 1. First, clustering analysis among manipulation chains across five quantification tools was conducted for (A) precision and (B) robustness. Second, a two-dimensional scatter plot (C) was drawn to provide the ranks of each chain (represented by gray dot) collectively determined by precision (horizontal axis) and robustness (vertical axis). The pink, blue, and green areas in C indicated the chains of good precision (A1+A2+A3 in A), good robustness (A1+A2 in B), and good performance for both precision and robustness, respectively. As a result, 396 chains (within the green area of C) were found to perform well under both criteria (precision and robustness).

