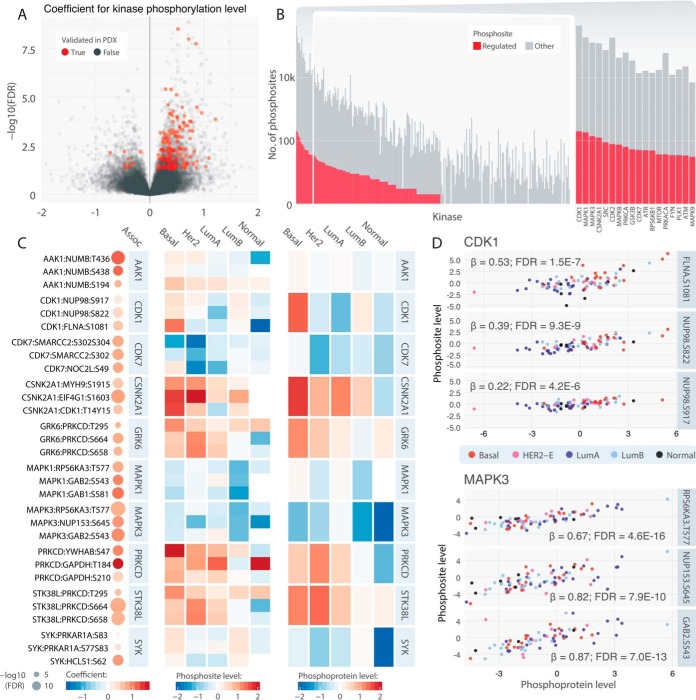
Fig. 3.
Trans kinase-substrate phosphosite pairs. A, Volcano plots highlighting positively associated pairs. Associations that were validated in PDX models (p < 0.05) are colored in red. B, Counts of trans-associated phosphosites among all corresponding phosphosites for each kinase. Kinases with more than 30 trans-associated phosphosites are shown individually in a close-up barplot (right). C, Top associated trans pairs and their average kinase phosphoprotein and substrate phosphosite levels in each of the breast cancer subtypes. On the left panel, each dot represents a trans association identified by the regression analysis, where its size represents the significance and color represents the regression coefficient. The middle and right panels illustrate the average trans-associated substrate phosphosite expression and kinase protein expression, respectively, in each of the breast cancer subtypes. D, Correlations of kinase phosphoprotein level of CDK1 and MAPK3 and their respective top 3 trans-associated phosphosites. Each dot represents one tumor sample colored according to its subtype.

