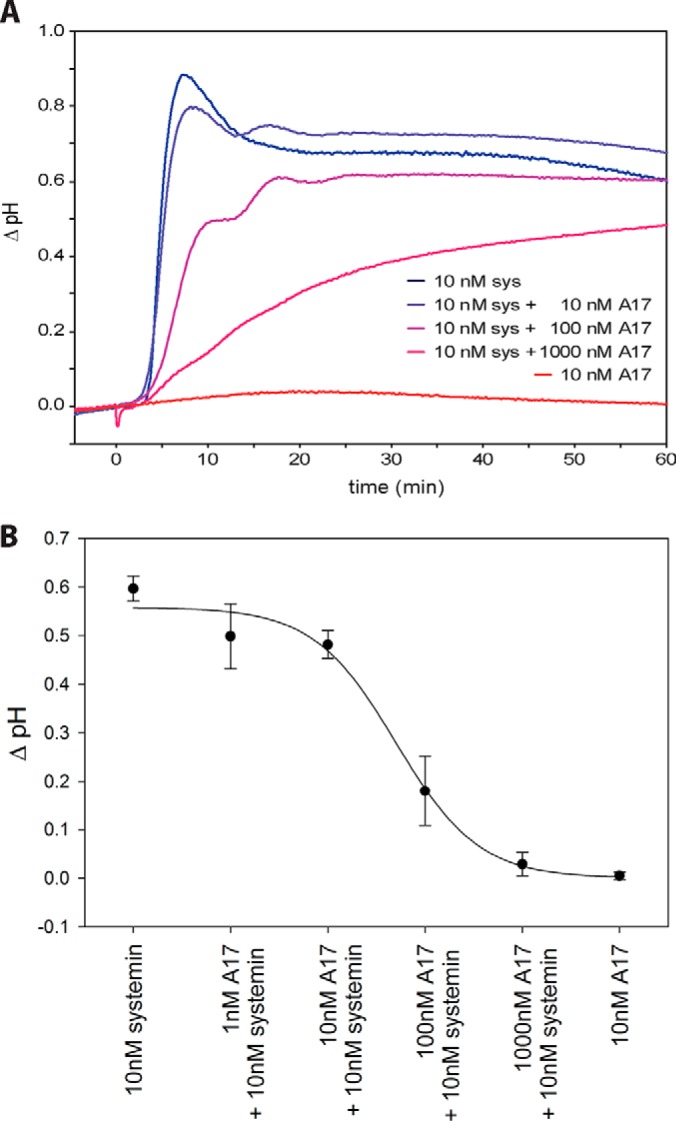
Fig. 1.

Alkalization response. A, Time course of pH change after systemin treatment (blue) and A17 treatment (red) as well as competition of systemin response with increasing concentrations of A17 (blue to red). B, Inhibition curve of A17. Data points show the mean with standard deviation from three independent experiments.
