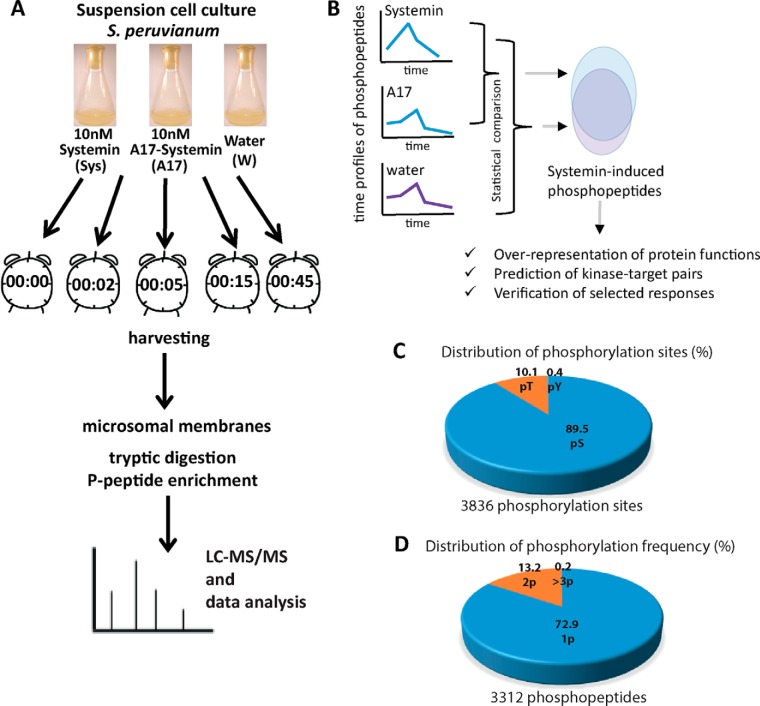
Fig. 2.
Analysis of the systemin signaling response. A, Experimental design and analytical workflow. B, Data analysis workflow: Definition of early systemin-induced phosphorylation responses and subsequent characterization of systemin signaling. C, Frequency distributions of 3312 identified phosphopeptides according to numbers of phosphorylation sites and phosphorylated amino acid as determined by MaxQuant. D, Frequency of phosphosites per peptide as determined by MaxQuant.

