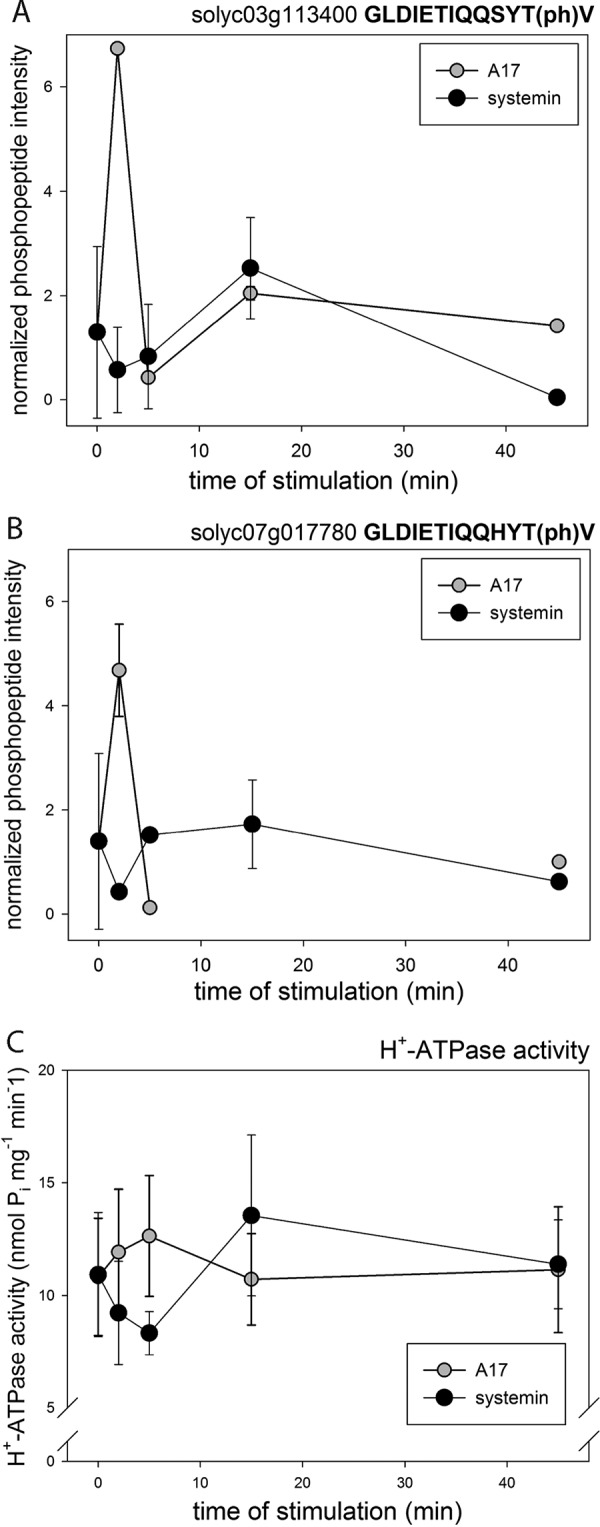
Fig. 4.

Phosphorylation of H+-ATPase and respiratory burst oxidase. A, C-terminal activating phosphorylation site of H+-ATPase Solyc03g113400. B, C-terminal activating phosphorylation site of H+-ATPase Solyc07g017780. C, H+-ATPase activity under treatment with systemin, A17, and water. Black triangles: systemin treatment; white triangles: A17 treatment. White circles: water treatment. Mean values of three biological replicates are shown with standard deviation.
