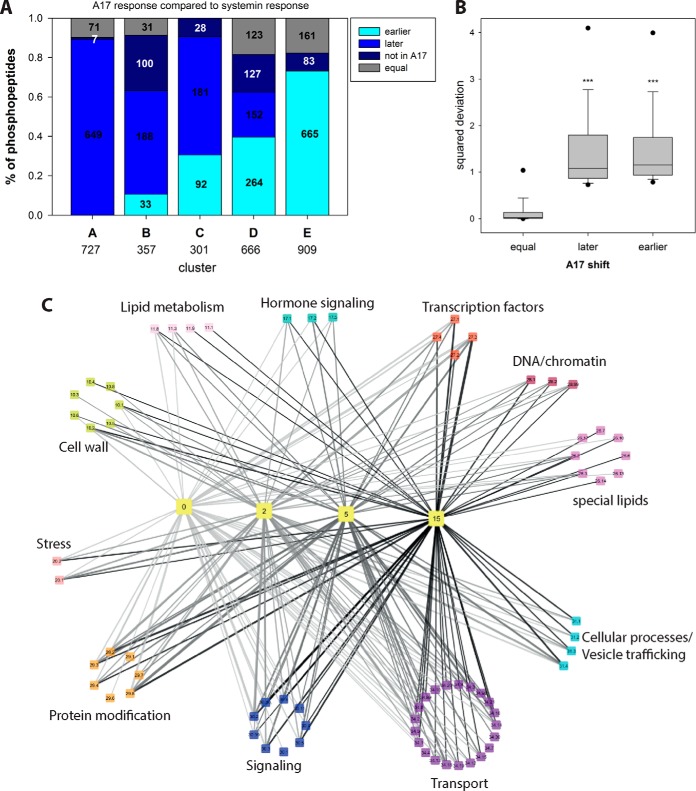
Fig. 5.
Over-representation analysis of functional groups in each cluster. A, Comparison of systemin and A17 responses. The proportion of phosphopeptides with a time-shifted response in A17 treatment compared with systemin treatment is displayed. “Late” peptides display a later phosphorylation maximum at A17 treatment compared with systemin treatment, or do not display any maximum at all. “Early” peptides have a phosphorylation maximum at earlier time points after A17 treatment compared with systemin stimulation, or they have a maximum in A17 treatment and remain unaltered under systemin treatment. Numbers indicate absolute numbers of classified phosphopeptides. B, Boxplot of square deviations of phosphopeptide classified as “equal,” “later,” or “earlier” under A17 treatment relative to the respective consensus cluster profile under systemin treatment. C, Network view of processes over-represented at different time points. Yellow colored “time”-nodes represent k-means clusters (Fig. 4) with maximum phosphorylation at respective time points. The “bin”-nodes represent the processes over-represented in the respective k-means clusters. Edges width represents the percentage of proteins of each bin within in each k-means cluster. Edge color indicates the processes involved at different time points. Bin code: 10 cell wall, 11 lipid metabolism, 17 hormone signaling, 20 stress responses, 26 special lipids, 27 RNA processes, 28 DNA processes, 29 protein processes, 30 signaling, 31 vesicle trafficking, 34 transport. Detailed listing in supplemental Table S3.

