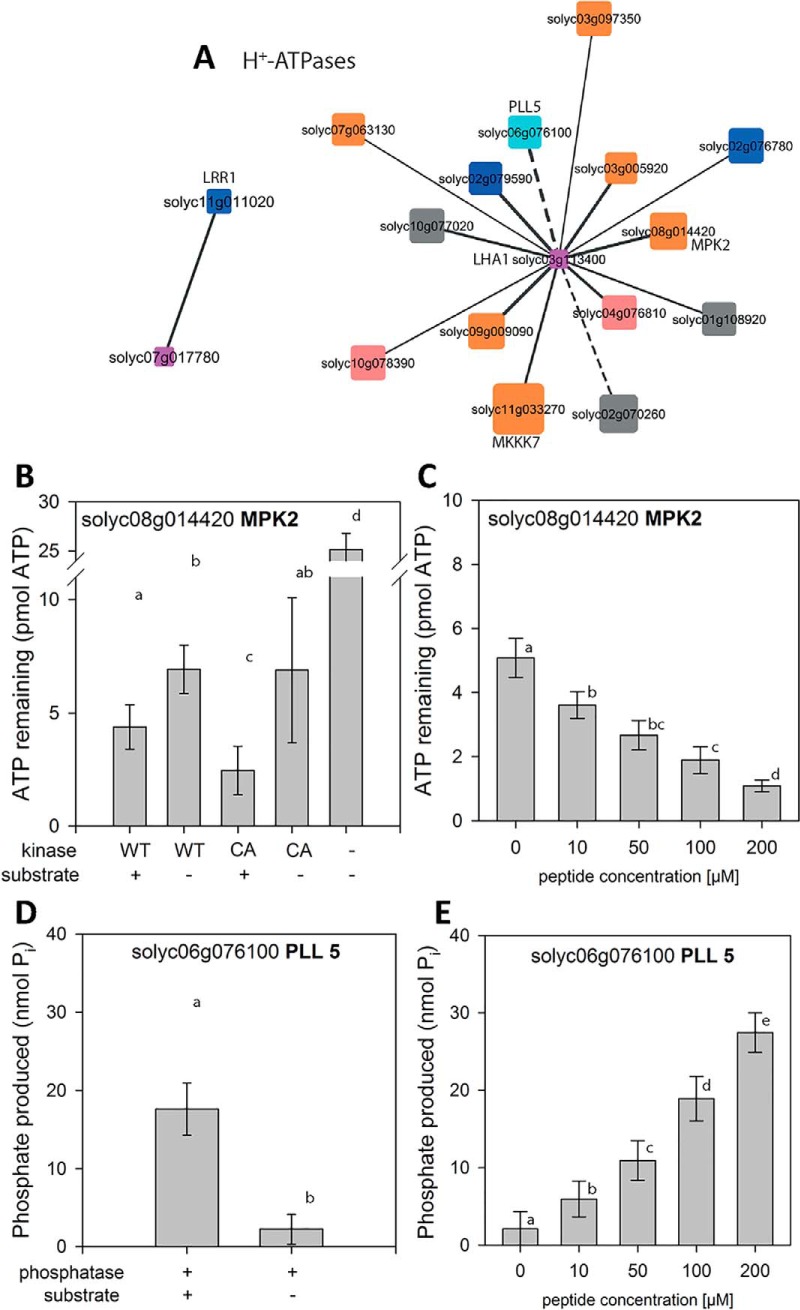
Fig. 7.
Kinase/phosphatase relationships with major targets. A, H+-ATPases AHA1 and LHA1. Solid edges represent kinase-substrate relationships, dashed edges represent phosphatase-kinase relationships. Node size indicates the degree in the overall network (Fig. 7), Node color represents Mapman function. Blue: receptor kinase (30.2), cyan: Phosphatases, red: calcium-dependent protein kinases, orange: protein.posttranslational modification (29.4), gray: unclassified function (35). B, ATP remaining after kinase MPK2 reaction using H+-ATPase peptide GLDIETIQQSYTV as a substrate. C, ATP remaining after MPK2 reaction with increasing concentrations of substrate peptide D, Phosphate produced by Phosphatase PLL5 in the reaction with H+-ATPase phosphopeptide GLDIETIQQSY(pT)V as a substrate. E, Phosphate produced by PLL5 reaction with increasing concentrations of substrate peptides. Data represent the mean with standard deviation. Activity assays were carried out on two independent protein isolations in two technical replicates.

