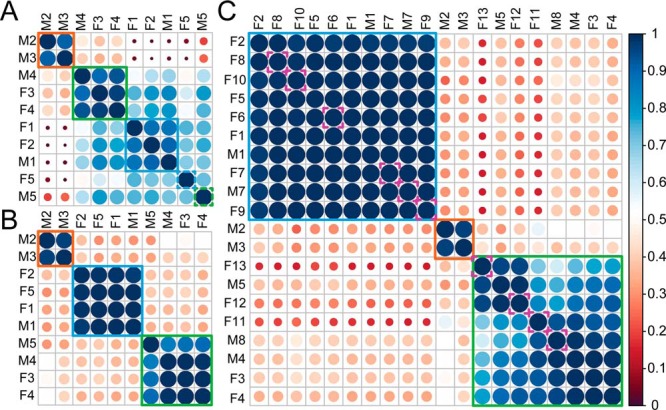
Fig. 4.

Classification of fetuin proteoform profiles by hierarchical clustering. A, Unsupervised clustering of fetuin proteoform profiles derived from the 10 healthy individuals based on the correlation between their native mass spectra. B, Clustering of fetuin proteoform profiles derived from 10 healthy individuals based on specific signature peaks (see supplemental Fig. S4). Color and size of the circles represent the similarity between the proteoform profiles of different genotypes. Orange, blue and green boxes represent fetuin originating from donors representing the AHSG*2, AHSG*1 and AHSG1/2 genotypes, respectively. Comparing the results in A and B the classification in A is distorted by two outliers derived from donor F5 (AHSG*1) and M5 (AHSG*2), respectively caused by a major change in fetuin phosphorylation in these two individuals. C, Clustering of fetuin proteoform profiles derived from 10 healthy and 10 septic patients based on specific signature peaks, where pink dashed line boxes indicate fetuin derived from septic individuals.
