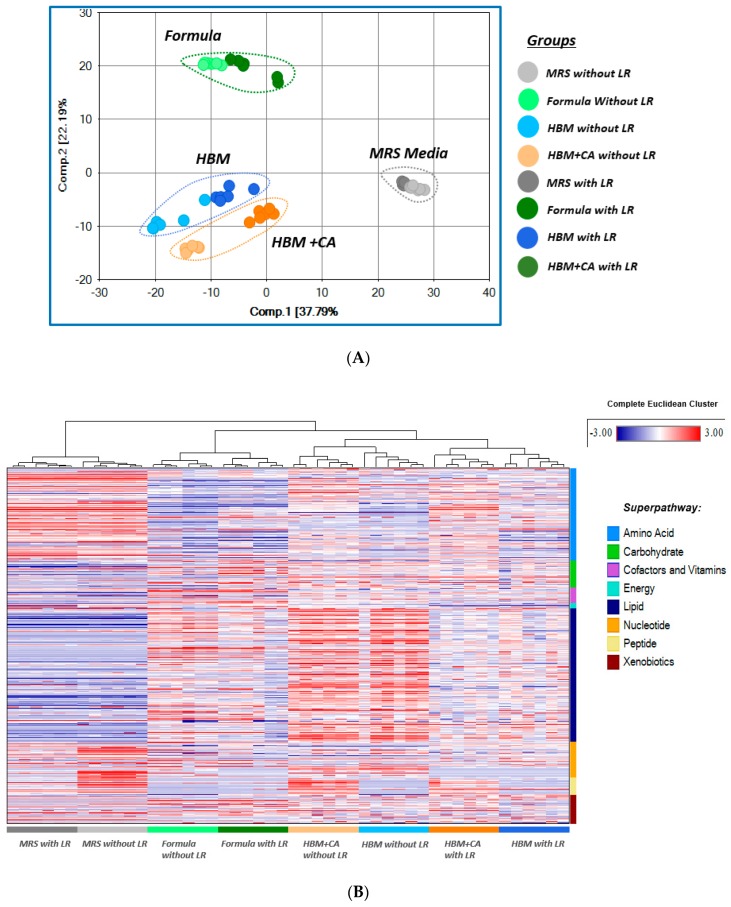
Figure 2.
(A) Principal component analysis (PCA) showed major segregation among the different media. (B) Hierarchical clustering analysis showed major segregation among the groups, based on both media and LR growth status. Each column represents a separate culturing sample (6 samples per group). Each horizontal line represents an identified metabolite (679 metabolites identified from mass spectrometry). Red indicates up-regulated metabolites, while blue indicates down-regulated metabolites.

