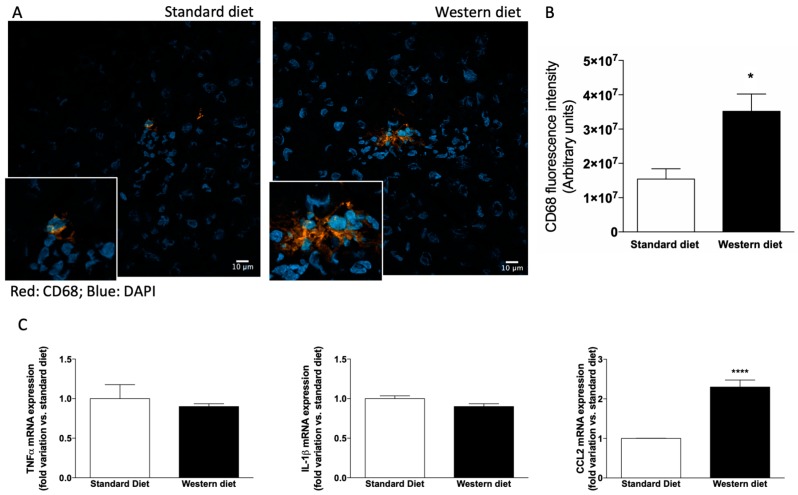
Figure 5.
CD-68 positive cells in the liver. (A) Representative photomicrographs of liver tissue obtained from a rat fed with standard (upper panel) and Western (lower panel) diet stained with CD-68, a marker of hepatic macrophages. (B) Quantification of CD-68-related immunofluorescence. Values are means ± S.E.M. The histograms report the intensity of fluorescence (arbitrary units). Representative images from five independent experiments are shown. Cell nuclei are stained blue with DAPI. (C) mRNA expression of genes involved in the inflammatory process. * p < 0.05, **** p < 0.0001 vs. rats fed with standard diet.

