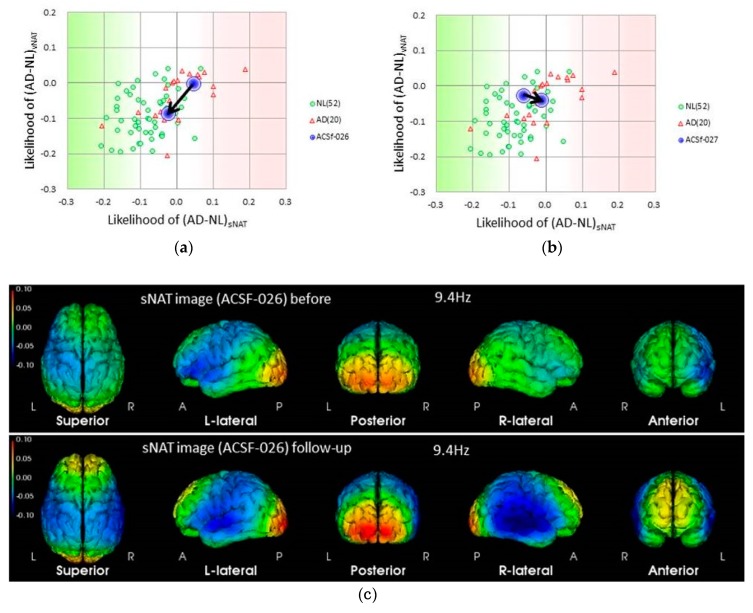
Figure 6.
Electroencephalograms (EEG) based evaluation of the change of neural activity in APOE4/E4 MCI subjects by the supplementation. (a) Changes in the EEG pattern of subject #26 (Active group) from the start to the end of the trial, shown by blue circles in a two-dimensional NAT plot (sNAT compared to vNAT [23]) with data from both Alzheimer’s disease (AD) subjects (red triangles) and normal control subjects (normal (NL), green circles); (b) changes in the EEG pattern of subject #27 (Placebo group) from the start to the end of the trial; (c) sNAT images of subject #26 at the startup visit (baseline) and at follow-up. Note the elevated alpha-band activity at the occipital lobe and frontal lobes, suggesting improved EEG activity after ACS.

