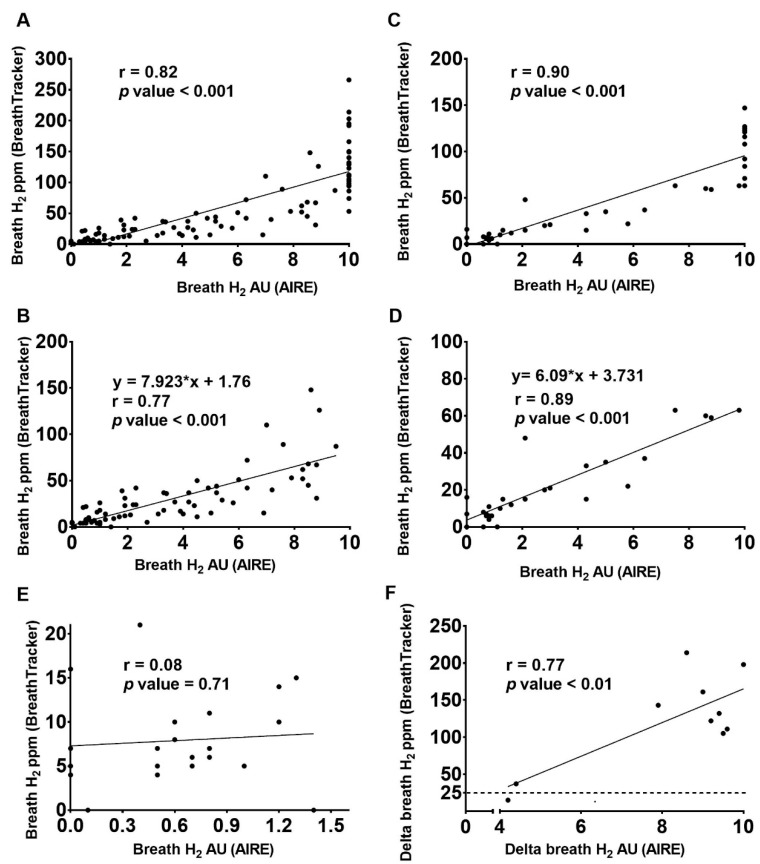
Figure 1.
Scatterplots with simple linear regression line showing the relationship between H2 readings from the AIRE (x-axis) and BreathTracker (y-axis), after lactose ingestion with all readings (A); after lactose ingestion with AIRE scores of 10 removed (B); after milk ingestion with all readings (C); after milk with AIRE scores of 10 removed (D); at baseline before lactose or milk ingestion (E); and the max delta after lactose ingestion (F). Figure 1A–D represent raw H2 readings i.e., the baseline is not subtracted.

