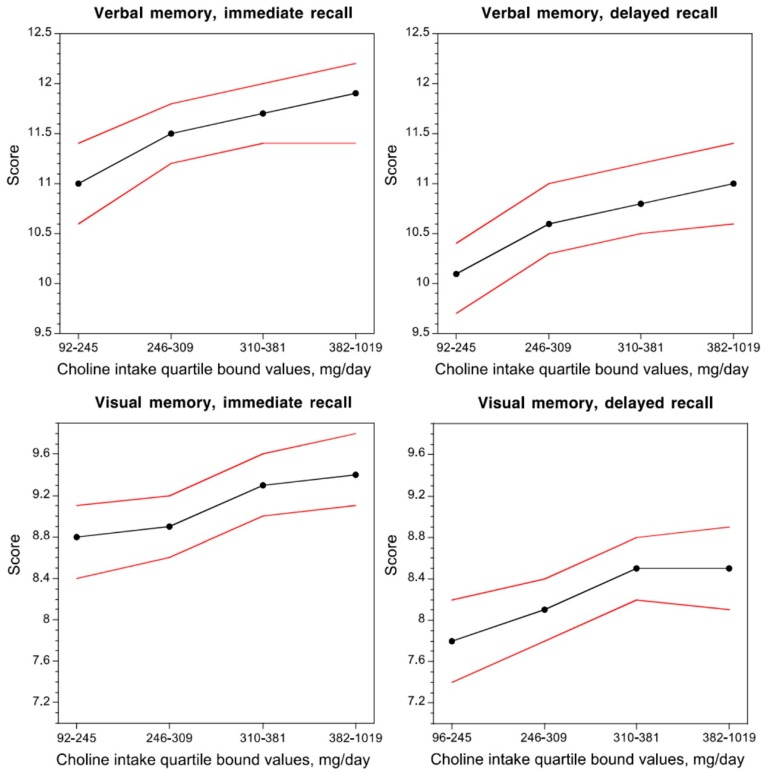
Figure 2.
Dose–response relationship between the average daily choline intake and verbal and visual memory performance in non-demented adults. Black lines indicate the mean score and red lines indicate 95% confidence interval. Figure reproduced from [44].

