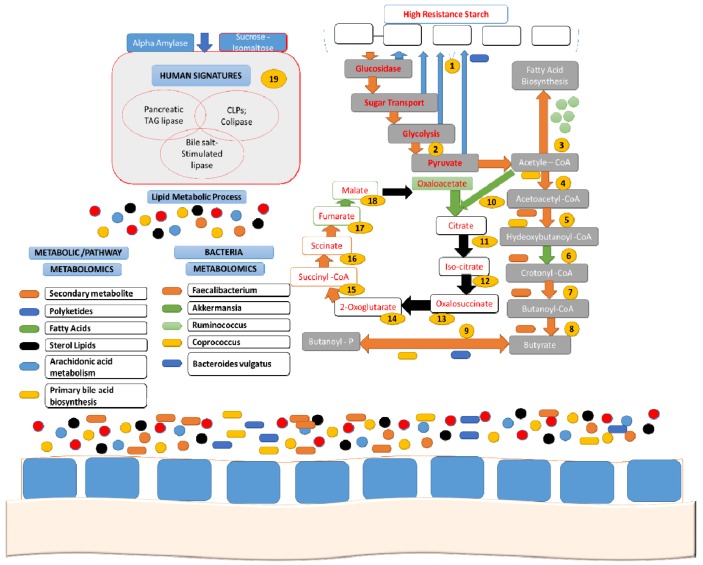
Figure 4.
Summary of distinguished enzymes, subsequent pathways, particular species, and specific metabolites that are expressively obstructed through a high resistant starch (HRS) diet. Blue arrows/frames, increased with HRS; orange frames, decreased with HRS; black arrows, not detected or not increased with HRS over baseline; green arrows/frames, increased with low resistant starch (LRS). 1, starch and metabolism of sucrose; 2, glucose to pyruvate leads to glycolysis pathway; 3, 3-oxoacyl-(acyl carrier protein) synthase; 4, acetyltransferase-based acetyl-CoA; 5, 3-hydroxyacyl-CoA dehydrogenase; 6, enoyl-CoA hydratase; 7, carrier protein enoyl-(acyl) reductase (NADH); 8, acetate transferase CoA; 9, butyrate kinase; 10, synthase citrate; 11, hydrataseaconitate; 12 and 13, dehydrogenase isocitrate; 14, Ferredoxin oxidoreductase-2-ketoglutarate; 15, CoA-synthetase-succinyl; 16, fumaratereductase/succinate dehydrogenase; 17, fumaratehydratase; 18, dehydrogenase malate; 19, human enzymes.

