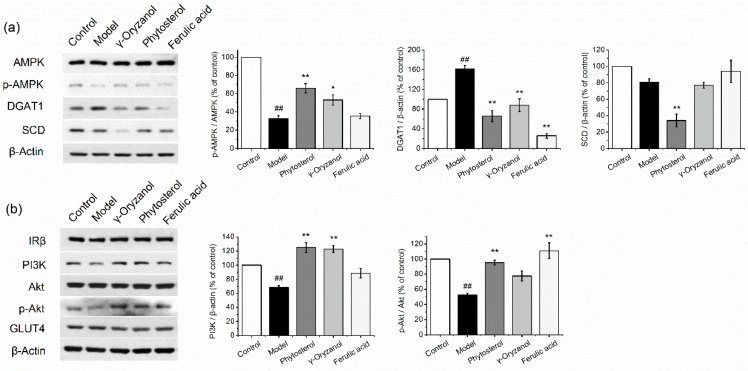
Figure 2.
Western blot analysis of lipid (a) and glucose (b) metabolism-related protein expressions in HepG2 cells. Proteins were extracted from induction medium (10 mM glucose, 15 mM fructose and 1 mM FFA)-treated HepG2 cells with or without functional components (100 μM). 1% BSA in incomplete DMEM was selected as the control. Data are presented as mean ± SEM (n = 3). ## p < 0.01 vs. control. * p < 0.05 vs. model. ** p < 0.01 vs. model.

