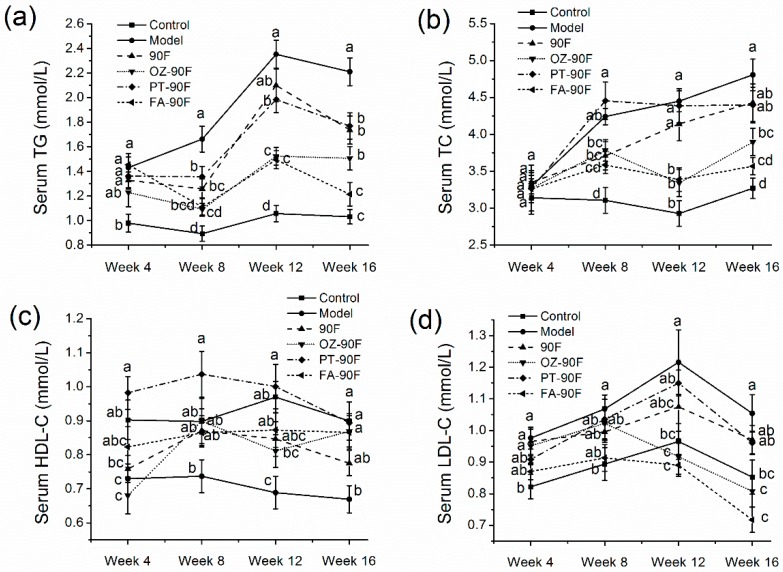
Figure 3.
Effect of enriched flour on serum lipid profiles in rats. Blood samples were collected from orbital venous at week 4, 8, 12 and 16 from 12 h fasted rats. (a) Serum TG level; (b) serum TC level; (c) serum HDL-C level; (d) serum LDL-C level. Data are presented as mean ± SEM (n = 10). Mean values from the same week with different letters are significantly different (p < 0.05). 90F, 90% wheat flour; OZ-90F, γ-oryzanol enriched 90% wheat flour; PT-90F, phytosterol enriched 90% wheat flour; FA-90F, ferulic acid enriched 90% wheat flour.

