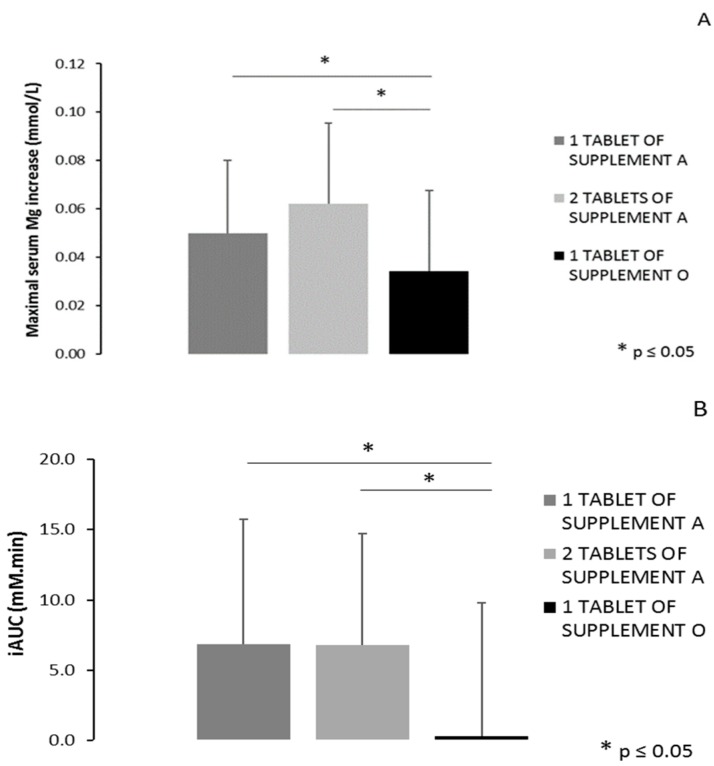
Figure 7.
(A) The difference in serum magnesium concentration between the peak value and the concentration before ingestion of one or two tablets of Supplement A vs. one tablet of Supplement O (* p = 0.048 for one tablet of Supplement A vs. Supplement O and p = 0.001 for two tablets of Supplement A vs. Supplement O). (B) The incremental area under the curve (iAUC) of the serum magnesium concentration starting from ingestion of the supplement up to six hours after ingestion (* p = 0.009 for one tablet of Supplement A vs. Supplement O and p = 0.011 for two tablets of Supplement A vs. Supplement O). * p ≤ 0.05.

