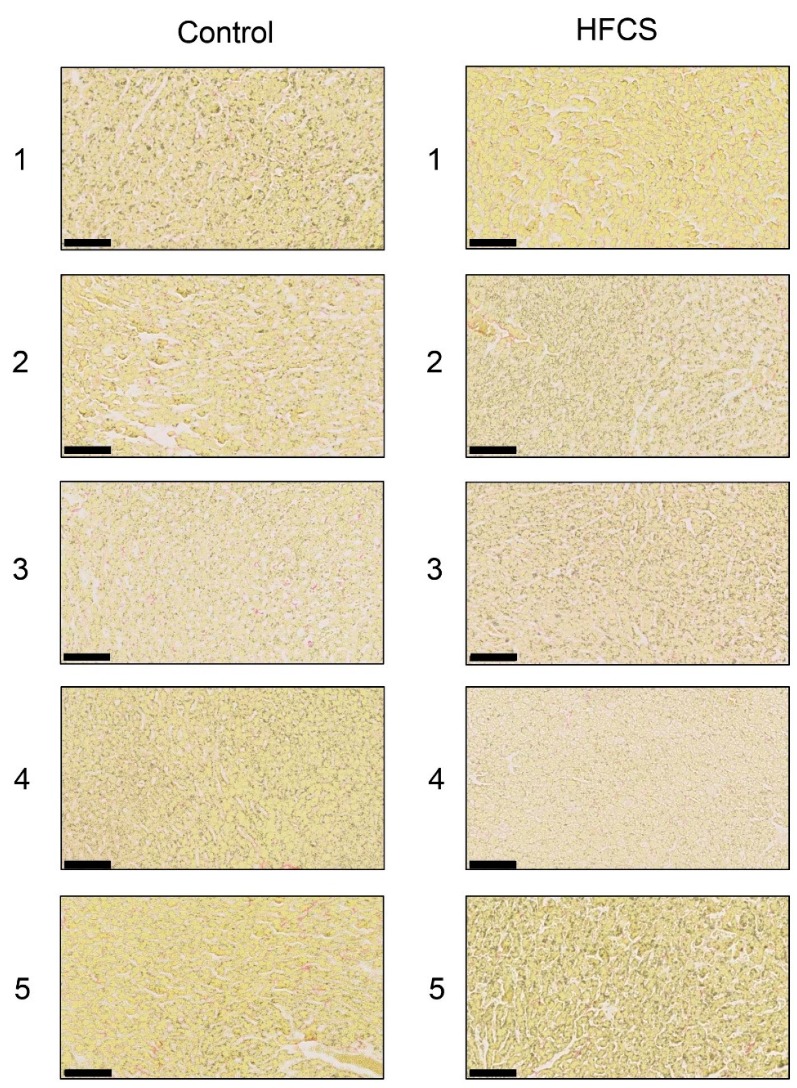
Figure 3.
Histological analysis of the liver with Sirius Red staining. Control; control group, HFCS; HFCS group. The numbers 1–5 indicate each rat in the control group (n = 5) or HFCS group (n = 5). Type I or III collagen-positive areas stained red in cells. Muscle fiber and cytoplasm areas stained yellow. The scale bar represents 100 μm.

