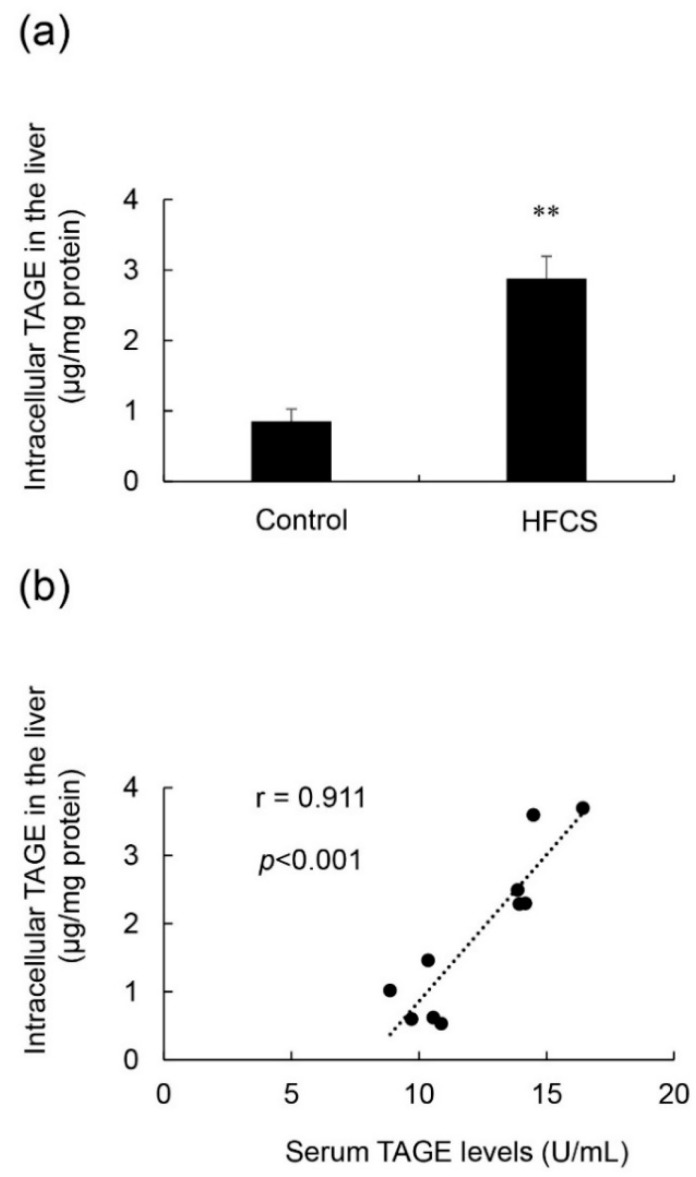
Figure 5.
Calculation of intracellular TAGE levels in the liver, and the relationship between intracellular TAGE and serum TAGE levels. (a) Control; control group (n = 5), HFCS; HFCS group (n = 5). Tissue lysates (10 μg of protein/lane) were loaded on the PVDF membrane, and proteins were probed with the anti-TAGE antibody or neutralized anti-TAGE antibody. The amount of TAGE was calculated based on a standard curve for TAGE-BSA. Data are shown as means ± S.E. (n = 5). p-Values were based on the Mann-Whitney U-test. ** p < 0.01 vs. control. (b) Relationship between intracellular TAGE levels in the liver and serum levels of TAGE (n = 10).

