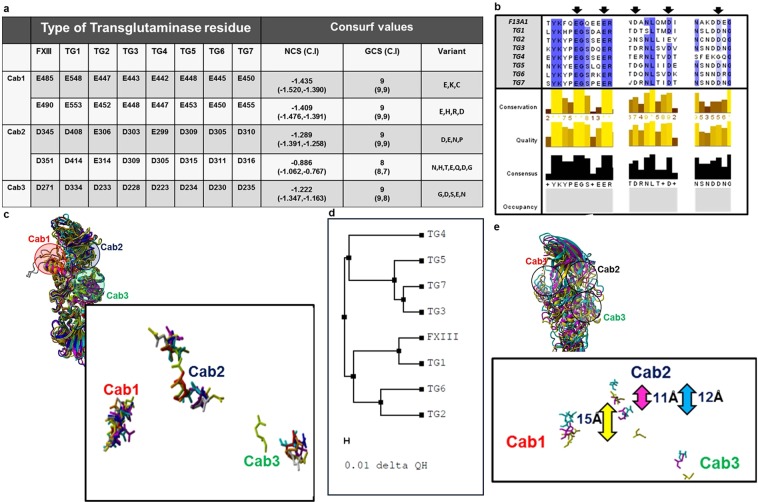
Figure 1.
Conservation of calcium binding sites in Transglutaminases with respect to FXIII-A. Panel a tabulates the conservation results generated for the FXIII-A amino acid sequence input (Uniprot ID: P00488; F13A_HUMAN) on the Consurf server. Abbreviations: NCS: Normalized conservation score, GCS: Generalized conservation score. Panel b illustrates the actual alignment generated as output on the Consurf server for the FXIII-A subunit sequence input. The highly conserved residues are shaded in blue. Arrows indicate the binding site residues mutated in this study. Panel c shows a structural alignment of all seven human Transglutaminases i.e. of three crystal structures TG2, TG3 and FXIII-A and threaded models for the remaining four transglutaminases. The structures are depicted in ribbon format. The inset image shows the spatial alignment of the calcium binding site residues of all transglutaminases as stick models. The different transglutaminases are colored differently. Panel d shows a structural similarity tree generated from the structural alignment on Panel c. The distances on the tree represented by the delta QH value is proportional to the dissimilarity between two structures i.e. the farther two structures are there on the tree, the more structurally unlike they are. Panel e shows the structural alignment of only three human Transglutaminases with biophysical crystal structures i.e. TG2, TG3 and FXIII-A. The inset diagram the spatial alignment of the calcium binding site residues as stick models of the three human transglutaminases. The structures are depicted in ribbon format with TG2, TG3 and FXIII colored yellow, magenta and cyan respectively. The bidirectional arrows represent the C-α backbone atom distances between the D345 and D351 residue (FXIII; cyan), E306 and E314 residue (TG2; yellow), and D303 and D309 residue (TG3; magenta).

